29
/
en
AIzaSyAYiBZKx7MnpbEhh9jyipgxe19OcubqV5w
April 1, 2024
195132
Mexico
MEX
true
2
1
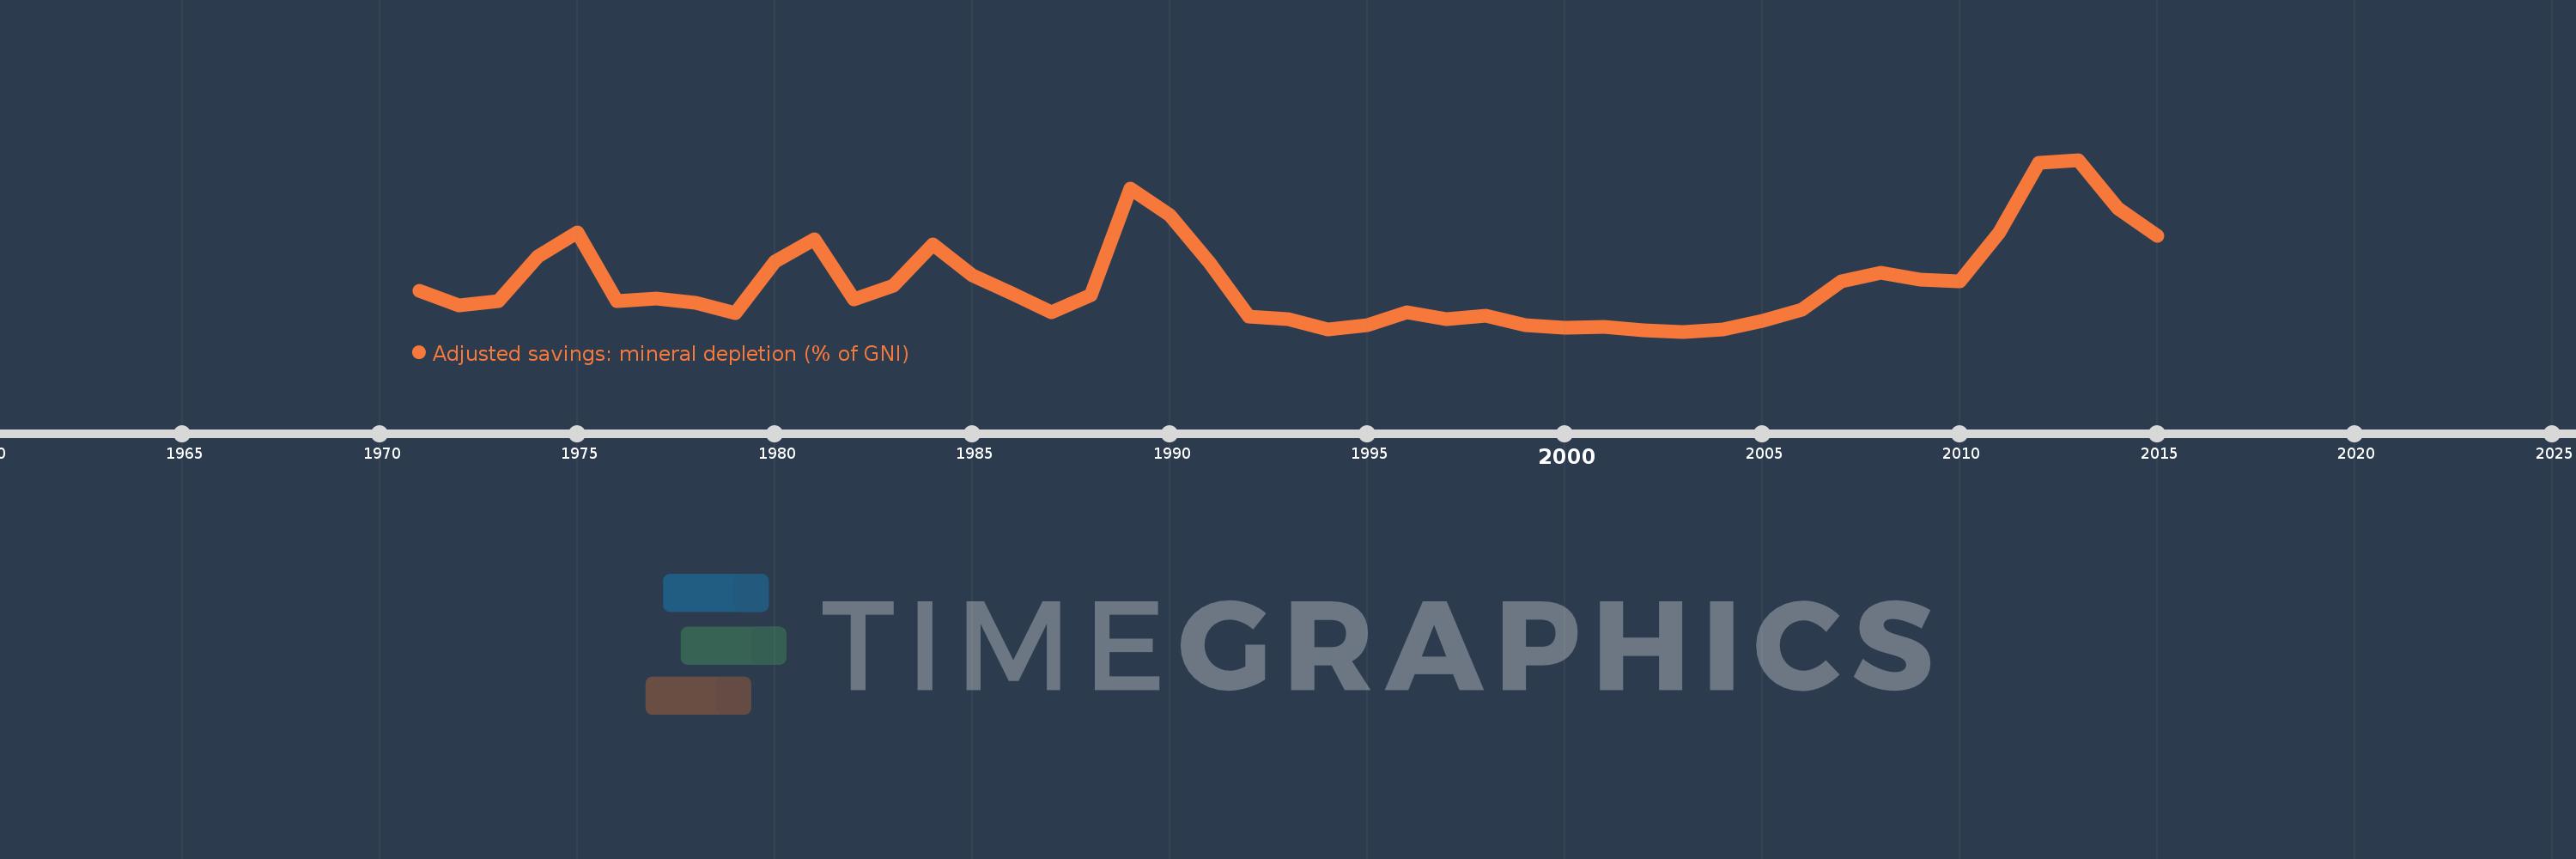
Adjusted savings: mineral depletion (% of GNI)
2015,2014,2013,2012,2011,2010,2009,2008,2007,2006,2005,2004,2003,2002,2001,2000,1999,1998,1997,1996,1995,1994,1993,1992,1991,1990,1989,1988,1987,1986,1985,1984,1983,1982,1981,1980,1979,1978,1977,1976,1975,1974,1973,1972,1971
This statistics in other country:
AfghanistanAlbaniaAlgeriaAmerican SamoaAndorraAngolaAntigua and BarbudaArab WorldArgentinaArmeniaAustraliaAustriaAzerbaijanBahamas, TheBahrainBangladeshBarbadosBelarusBelgiumBelizeBeninBermudaBhutanBoliviaBosnia and HerzegovinaBotswanaBrazilBrunei DarussalamBulgariaBurkina FasoBurundiCabo VerdeCambodiaCameroonCanadaCaribbean small statesCentral African RepublicCentral Europe and the BalticsChadChannel IslandsChileChinaColombiaComorosCongo, Dem. Rep.Congo, Rep.Costa RicaCote d'IvoireCroatiaCubaCyprusCzech RepublicDenmarkDjiboutiDominicaDominican RepublicEarly-demographic dividendEast Asia & PacificEast Asia & Pacific (excluding high income)East Asia & Pacific (IDA & IBRD countries)EcuadorEgypt, Arab Rep.El SalvadorEquatorial GuineaEritreaEstoniaEthiopiaEuro areaEurope & Central AsiaEurope & Central Asia (excluding high income)Europe & Central Asia (IDA & IBRD countries)European UnionFaroe IslandsFijiFinlandFragile and conflict affected situationsFranceFrench PolynesiaGabonGambia, TheGeorgiaGermanyGhanaGreeceGreenlandGrenadaGuatemalaGuineaGuinea-BissauGuyanaHaitiHeavily indebted poor countries (HIPC)High incomeHondurasHong Kong SAR, ChinaHungaryIBRD onlyIcelandIDA & IBRD totalIDA blendIDA onlyIDA totalIndiaIndonesiaIran, Islamic Rep.IraqIrelandIsle of ManIsraelItalyJamaicaJapanJordanKazakhstanKenyaKiribatiKorea, Rep.KosovoKuwaitKyrgyz RepublicLao PDRLate-demographic dividendLatin America & Caribbean Latin America & Caribbean (excluding high income)Latin America & the Caribbean (IDA & IBRD countries)LatviaLeast developed countries: UN classificationLebanonLesothoLiberiaLibyaLiechtensteinLithuaniaLow & middle incomeLow incomeLower middle incomeLuxembourgMacao SAR, ChinaMacedonia, FYRMadagascarMalawiMalaysiaMaldivesMaliMaltaMarshall IslandsMauritaniaMauritiusMexicoMicronesia, Fed. Sts.Middle East & North AfricaMiddle East & North Africa (excluding high income)Middle East & North Africa (IDA & IBRD countries)Middle incomeMoldovaMonacoMongoliaMontenegroMoroccoMozambiqueMyanmarNamibiaNepalNetherlandsNew CaledoniaNew ZealandNicaraguaNigerNigeriaNorth AmericaNorwayOECD membersOmanOther small statesPacific island small statesPakistanPalauPanamaPapua New GuineaParaguayPeruPhilippinesPolandPortugalPost-demographic dividendPre-demographic dividendPuerto RicoQatarRomaniaRussian FederationRwandaSamoaSan MarinoSao Tome and PrincipeSaudi ArabiaSenegalSerbiaSeychellesSierra LeoneSingaporeSlovak RepublicSloveniaSmall statesSolomon IslandsSomaliaSouth AfricaSouth AsiaSouth Asia (IDA & IBRD)South SudanSpainSri LankaSt. Kitts and NevisSt. LuciaSt. Vincent and the GrenadinesSub-Saharan Africa Sub-Saharan Africa (excluding high income)Sub-Saharan Africa (IDA & IBRD countries)SudanSurinameSwazilandSwedenSwitzerlandSyrian Arab RepublicTajikistanTanzaniaThailandTimor-LesteTogoTongaTrinidad and TobagoTunisiaTurkeyTurkmenistanTuvaluUgandaUkraineUnited Arab EmiratesUnited KingdomUnited StatesUpper middle incomeUruguayUzbekistanVanuatuVenezuela, RBVietnamVirgin Islands (U.S.)West Bank and GazaWorldYemen, Rep.ZambiaZimbabwe Timeline:
This timeline shows a graph from 1971 to 2015 of Mexico. No data until 1970. Number of actual observations by date: 45.
Source name:
World Development Indicators
Source organization:
World Bank staff estimates based on sources and methods in World Bank's "The Changing Wealth of Nations: Measuring Sustainable Development in the New Millennium" (2011).
Categories, topics:
Economy & Growth, Energy & Mining, Environment
Last updated:
apr 23, 2017
Indicators value changes by year
At the date of observation
Value
Absolute change
Change from previous value
jan 1, 1971
0.191
+0.191
0.0%
jan 1, 1972
0.129
-0.062
-32.42%
jan 1, 1973
0.149
+0.02
15.32%
jan 1, 1974
0.341
+0.192
128.98%
jan 1, 1975
0.442
+0.102
29.81%
jan 1, 1976
0.146
-0.296
-67.0%
jan 1, 1977
0.157
+0.011
7.61%
jan 1, 1978
0.141
-0.016
-10.14%
jan 1, 1979
0.094
-0.047
-33.12%
jan 1, 1980
0.319
+0.224
237.39%
jan 1, 1981
0.414
+0.096
30.02%
jan 1, 1982
0.154
-0.26
-62.82%
jan 1, 1983
0.215
+0.061
39.71%
jan 1, 1984
0.393
+0.178
82.6%
jan 1, 1985
0.259
-0.134
-34.13%
jan 1, 1986
0.179
-0.08
-30.97%
jan 1, 1987
0.099
-0.079
-44.46%
jan 1, 1988
0.174
+0.075
75.53%
jan 1, 1989
0.631
+0.457
262.25%
jan 1, 1990
0.518
-0.113
-17.91%
jan 1, 1991
0.315
-0.202
-39.07%
jan 1, 1992
0.08
-0.235
-74.61%
jan 1, 1993
0.071
-0.009
-11.1%
jan 1, 1994
0.026
-0.045
-63.72%
jan 1, 1995
0.043
+0.017
67.06%
jan 1, 1996
0.1
+0.057
131.75%
jan 1, 1997
0.069
-0.031
-30.58%
jan 1, 1998
0.085
+0.016
22.95%
jan 1, 1999
0.042
-0.043
-50.4%
jan 1, 2000
0.034
-0.008
-19.64%
jan 1, 2001
0.038
+0.004
10.82%
jan 1, 2002
0.022
-0.016
-42.97%
jan 1, 2003
0.016
-0.006
-26.36%
jan 1, 2004
0.024
+0.008
52.48%
jan 1, 2005
0.063
+0.039
160.96%
jan 1, 2006
0.11
+0.047
74.82%
jan 1, 2007
0.234
+0.124
112.82%
jan 1, 2008
0.27
+0.036
15.19%
jan 1, 2009
0.241
-0.029
-10.62%
jan 1, 2010
0.232
-0.009
-3.76%
jan 1, 2011
0.445
+0.212
91.47%
jan 1, 2012
0.742
+0.297
66.8%
jan 1, 2013
0.756
+0.014
1.95%
jan 1, 2014
0.548
-0.208
-27.48%
jan 1, 2015
0.428
-0.121
-22.04%
Ranking of countries by current statistics by years


Comments: