29
/
en
AIzaSyAYiBZKx7MnpbEhh9jyipgxe19OcubqV5w
April 1, 2024
162156
Jamaica
JAM
true
2
1
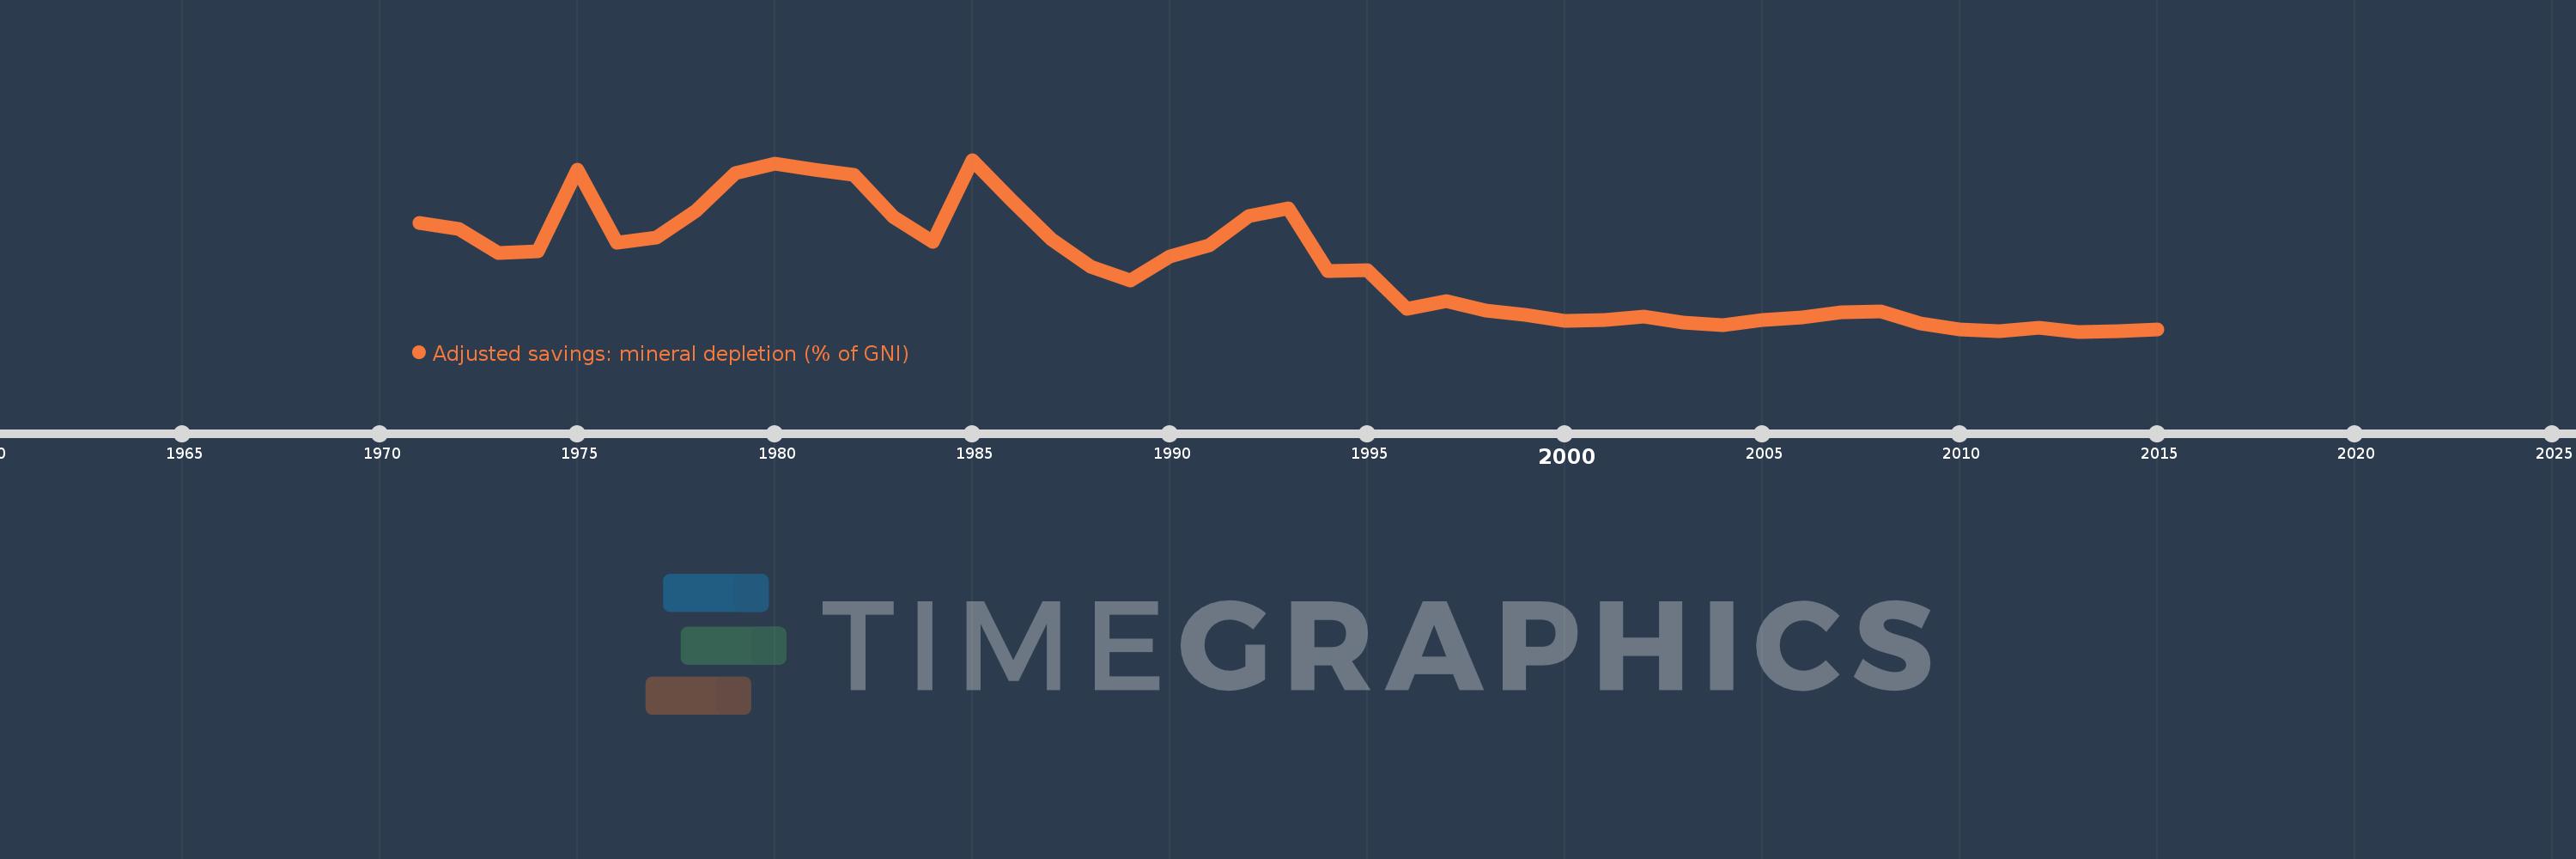
Adjusted savings: mineral depletion (% of GNI)
2015,2014,2013,2012,2011,2010,2009,2008,2007,2006,2005,2004,2003,2002,2001,2000,1999,1998,1997,1996,1995,1994,1993,1992,1991,1990,1989,1988,1987,1986,1985,1984,1983,1982,1981,1980,1979,1978,1977,1976,1975,1974,1973,1972,1971
This statistics in other country:
AfghanistanAlbaniaAlgeriaAmerican SamoaAndorraAngolaAntigua and BarbudaArab WorldArgentinaArmeniaAustraliaAustriaAzerbaijanBahamas, TheBahrainBangladeshBarbadosBelarusBelgiumBelizeBeninBermudaBhutanBoliviaBosnia and HerzegovinaBotswanaBrazilBrunei DarussalamBulgariaBurkina FasoBurundiCabo VerdeCambodiaCameroonCanadaCaribbean small statesCentral African RepublicCentral Europe and the BalticsChadChannel IslandsChileChinaColombiaComorosCongo, Dem. Rep.Congo, Rep.Costa RicaCote d'IvoireCroatiaCubaCyprusCzech RepublicDenmarkDjiboutiDominicaDominican RepublicEarly-demographic dividendEast Asia & PacificEast Asia & Pacific (excluding high income)East Asia & Pacific (IDA & IBRD countries)EcuadorEgypt, Arab Rep.El SalvadorEquatorial GuineaEritreaEstoniaEthiopiaEuro areaEurope & Central AsiaEurope & Central Asia (excluding high income)Europe & Central Asia (IDA & IBRD countries)European UnionFaroe IslandsFijiFinlandFragile and conflict affected situationsFranceFrench PolynesiaGabonGambia, TheGeorgiaGermanyGhanaGreeceGreenlandGrenadaGuatemalaGuineaGuinea-BissauGuyanaHaitiHeavily indebted poor countries (HIPC)High incomeHondurasHong Kong SAR, ChinaHungaryIBRD onlyIcelandIDA & IBRD totalIDA blendIDA onlyIDA totalIndiaIndonesiaIran, Islamic Rep.IraqIrelandIsle of ManIsraelItalyJamaicaJapanJordanKazakhstanKenyaKiribatiKorea, Rep.KosovoKuwaitKyrgyz RepublicLao PDRLate-demographic dividendLatin America & Caribbean Latin America & Caribbean (excluding high income)Latin America & the Caribbean (IDA & IBRD countries)LatviaLeast developed countries: UN classificationLebanonLesothoLiberiaLibyaLiechtensteinLithuaniaLow & middle incomeLow incomeLower middle incomeLuxembourgMacao SAR, ChinaMacedonia, FYRMadagascarMalawiMalaysiaMaldivesMaliMaltaMarshall IslandsMauritaniaMauritiusMexicoMicronesia, Fed. Sts.Middle East & North AfricaMiddle East & North Africa (excluding high income)Middle East & North Africa (IDA & IBRD countries)Middle incomeMoldovaMonacoMongoliaMontenegroMoroccoMozambiqueMyanmarNamibiaNepalNetherlandsNew CaledoniaNew ZealandNicaraguaNigerNigeriaNorth AmericaNorwayOECD membersOmanOther small statesPacific island small statesPakistanPalauPanamaPapua New GuineaParaguayPeruPhilippinesPolandPortugalPost-demographic dividendPre-demographic dividendPuerto RicoQatarRomaniaRussian FederationRwandaSamoaSan MarinoSao Tome and PrincipeSaudi ArabiaSenegalSerbiaSeychellesSierra LeoneSingaporeSlovak RepublicSloveniaSmall statesSolomon IslandsSomaliaSouth AfricaSouth AsiaSouth Asia (IDA & IBRD)South SudanSpainSri LankaSt. Kitts and NevisSt. LuciaSt. Vincent and the GrenadinesSub-Saharan Africa Sub-Saharan Africa (excluding high income)Sub-Saharan Africa (IDA & IBRD countries)SudanSurinameSwazilandSwedenSwitzerlandSyrian Arab RepublicTajikistanTanzaniaThailandTimor-LesteTogoTongaTrinidad and TobagoTunisiaTurkeyTurkmenistanTuvaluUgandaUkraineUnited Arab EmiratesUnited KingdomUnited StatesUpper middle incomeUruguayUzbekistanVanuatuVenezuela, RBVietnamVirgin Islands (U.S.)West Bank and GazaWorldYemen, Rep.ZambiaZimbabwe Timeline:
This timeline shows a graph from 1971 to 2015 of Jamaica. No data until 1970. Number of actual observations by date: 45.
Source name:
World Development Indicators
Source organization:
World Bank staff estimates based on sources and methods in World Bank's "The Changing Wealth of Nations: Measuring Sustainable Development in the New Millennium" (2011).
Categories, topics:
Economy & Growth, Energy & Mining, Environment
Last updated:
apr 23, 2017
Indicators value changes by year
At the date of observation
Value
Absolute change
Change from previous value
jan 1, 1971
3.644
+3.644
0.0%
jan 1, 1972
3.467
-0.176
-4.84%
jan 1, 1973
2.741
-0.727
-20.96%
jan 1, 1974
2.787
+0.046
1.69%
jan 1, 1975
5.22
+2.433
87.31%
jan 1, 1976
3.053
-2.167
-41.51%
jan 1, 1977
3.208
+0.156
5.1%
jan 1, 1978
4.005
+0.797
24.83%
jan 1, 1979
5.107
+1.102
27.52%
jan 1, 1980
5.402
+0.294
5.77%
jan 1, 1981
5.224
-0.178
-3.29%
jan 1, 1982
5.057
-0.166
-3.18%
jan 1, 1983
3.823
-1.234
-24.4%
jan 1, 1984
3.074
-0.749
-19.6%
jan 1, 1985
5.505
+2.431
79.08%
jan 1, 1986
4.306
-1.199
-21.78%
jan 1, 1987
3.161
-1.144
-26.58%
jan 1, 1988
2.349
-0.812
-25.7%
jan 1, 1989
1.934
-0.415
-17.65%
jan 1, 1990
2.655
+0.72
37.25%
jan 1, 1991
2.968
+0.314
11.81%
jan 1, 1992
3.852
+0.884
29.78%
jan 1, 1993
4.075
+0.223
5.79%
jan 1, 1994
2.222
-1.853
-45.47%
jan 1, 1995
2.227
+0.005
0.21%
jan 1, 1996
1.105
-1.122
-50.39%
jan 1, 1997
1.316
+0.211
19.12%
jan 1, 1998
1.05
-0.266
-20.19%
jan 1, 1999
0.927
-0.123
-11.68%
jan 1, 2000
0.74
-0.187
-20.16%
jan 1, 2001
0.761
+0.02
2.74%
jan 1, 2002
0.865
+0.104
13.64%
jan 1, 2003
0.69
-0.174
-20.16%
jan 1, 2004
0.623
-0.067
-9.71%
jan 1, 2005
0.774
+0.151
24.18%
jan 1, 2006
0.846
+0.072
9.34%
jan 1, 2007
0.991
+0.145
17.13%
jan 1, 2008
1.026
+0.034
3.48%
jan 1, 2009
0.661
-0.365
-35.57%
jan 1, 2010
0.493
-0.168
-25.44%
jan 1, 2011
0.439
-0.054
-10.92%
jan 1, 2012
0.541
+0.102
23.28%
jan 1, 2013
0.421
-0.12
-22.14%
jan 1, 2014
0.423
+0.001
0.28%
jan 1, 2015
0.482
+0.059
13.99%
Ranking of countries by current statistics by years


Comments: