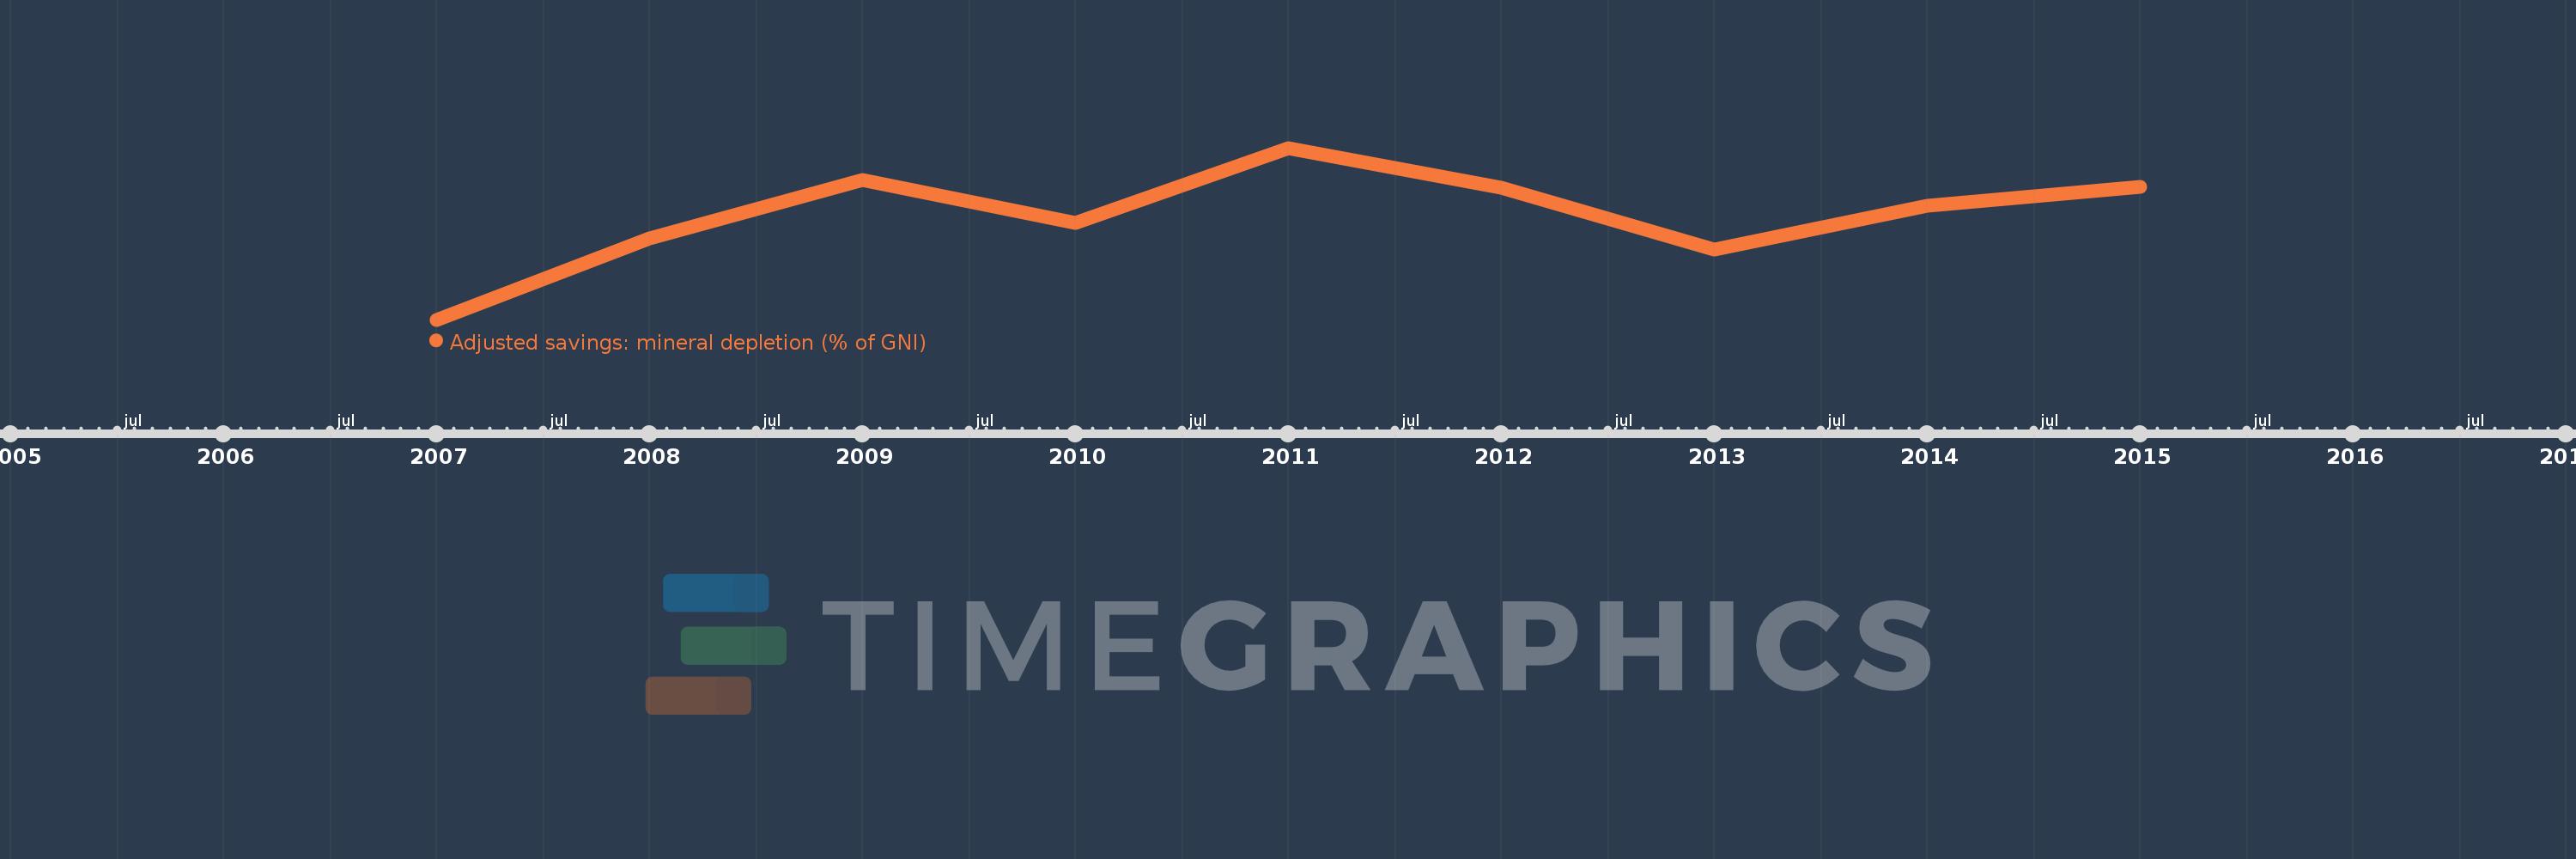
This timeline shows a graph from 2007 to 2015 of Kosovo. No data until 2006. Number of actual observations by date: 9.
Source name:
World Development Indicators
Source organization:
World Bank staff estimates based on sources and methods in World Bank's "The Changing Wealth of Nations: Measuring Sustainable Development in the New Millennium" (2011).
Categories, topics:
Economy & Growth, Energy & Mining, Environment
Last updated:
apr 23, 2017
Indicators value changes by year
Meaning:
0.69
Minimum:
0.079
jan 1, 2007
Maximum:
1.084
jan 1, 2011
At the date of observation
Value
Absolute change
Change from the previous value
jan 1, 2007
0.079
+0.079
0.0%
jan 1, 2008
0.555
+0.475
598.38%
jan 1, 2009
0.899
+0.344
61.97%
jan 1, 2010
0.644
-0.255
-28.38%
jan 1, 2011
1.084
+0.441
68.47%
jan 1, 2012
0.85
-0.234
-21.58%
jan 1, 2013
0.492
-0.358
-42.14%
jan 1, 2014
0.746
+0.254
51.7%
jan 1, 2015
0.856
+0.11
14.67%
Ranking of countries by current statistics by years
