29
/
en
AIzaSyAYiBZKx7MnpbEhh9jyipgxe19OcubqV5w
April 1, 2024
51636
North America
NAC
false
2
1
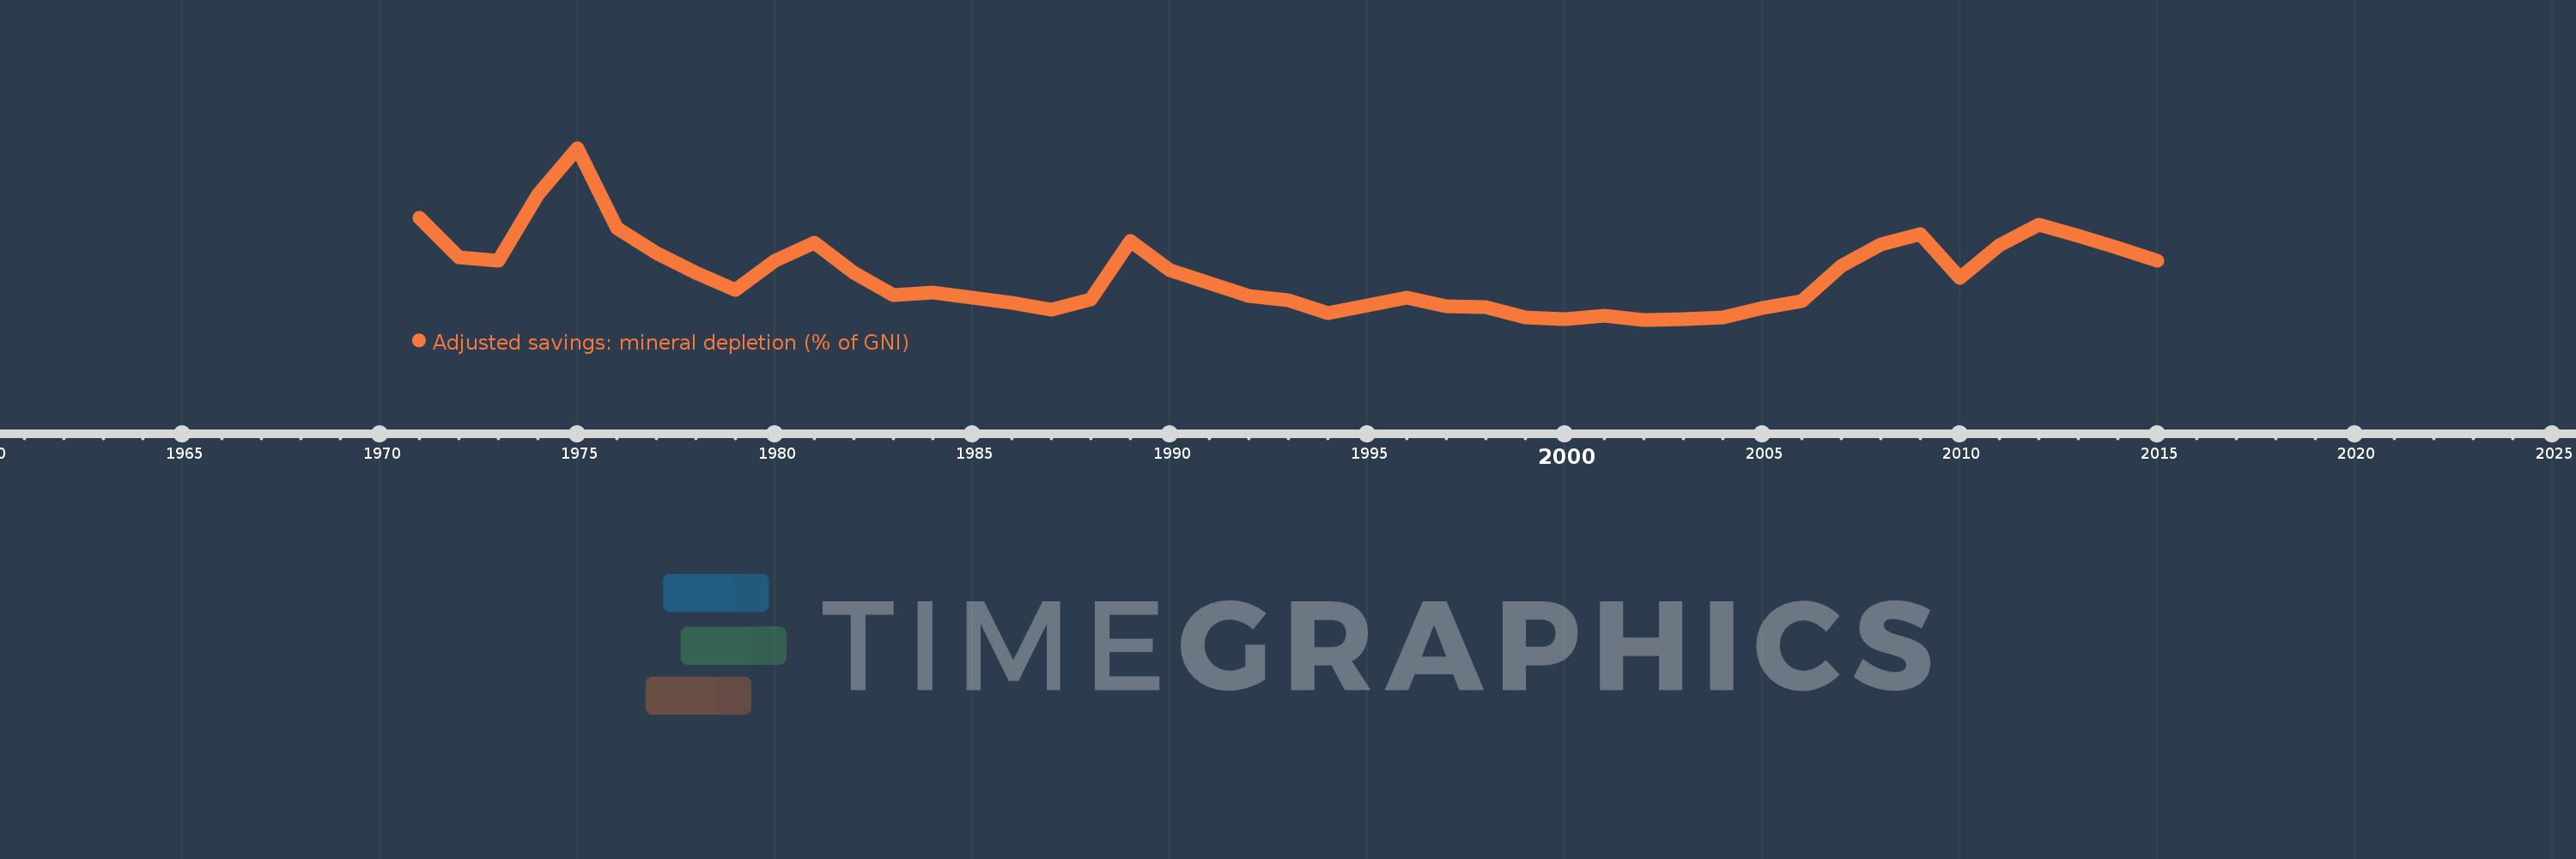
Adjusted savings: mineral depletion (% of GNI)
2015,2014,2013,2012,2011,2010,2009,2008,2007,2006,2005,2004,2003,2002,2001,2000,1999,1998,1997,1996,1995,1994,1993,1992,1991,1990,1989,1988,1987,1986,1985,1984,1983,1982,1981,1980,1979,1978,1977,1976,1975,1974,1973,1972,1971
This statistics in other country:
AfghanistanAlbaniaAlgeriaAmerican SamoaAndorraAngolaAntigua and BarbudaArab WorldArgentinaArmeniaAustraliaAustriaAzerbaijanBahamas, TheBahrainBangladeshBarbadosBelarusBelgiumBelizeBeninBermudaBhutanBoliviaBosnia and HerzegovinaBotswanaBrazilBrunei DarussalamBulgariaBurkina FasoBurundiCabo VerdeCambodiaCameroonCanadaCaribbean small statesCentral African RepublicCentral Europe and the BalticsChadChannel IslandsChileChinaColombiaComorosCongo, Dem. Rep.Congo, Rep.Costa RicaCote d'IvoireCroatiaCubaCyprusCzech RepublicDenmarkDjiboutiDominicaDominican RepublicEarly-demographic dividendEast Asia & PacificEast Asia & Pacific (excluding high income)East Asia & Pacific (IDA & IBRD countries)EcuadorEgypt, Arab Rep.El SalvadorEquatorial GuineaEritreaEstoniaEthiopiaEuro areaEurope & Central AsiaEurope & Central Asia (excluding high income)Europe & Central Asia (IDA & IBRD countries)European UnionFaroe IslandsFijiFinlandFragile and conflict affected situationsFranceFrench PolynesiaGabonGambia, TheGeorgiaGermanyGhanaGreeceGreenlandGrenadaGuatemalaGuineaGuinea-BissauGuyanaHaitiHeavily indebted poor countries (HIPC)High incomeHondurasHong Kong SAR, ChinaHungaryIBRD onlyIcelandIDA & IBRD totalIDA blendIDA onlyIDA totalIndiaIndonesiaIran, Islamic Rep.IraqIrelandIsle of ManIsraelItalyJamaicaJapanJordanKazakhstanKenyaKiribatiKorea, Rep.KosovoKuwaitKyrgyz RepublicLao PDRLate-demographic dividendLatin America & Caribbean Latin America & Caribbean (excluding high income)Latin America & the Caribbean (IDA & IBRD countries)LatviaLeast developed countries: UN classificationLebanonLesothoLiberiaLibyaLiechtensteinLithuaniaLow & middle incomeLow incomeLower middle incomeLuxembourgMacao SAR, ChinaMacedonia, FYRMadagascarMalawiMalaysiaMaldivesMaliMaltaMarshall IslandsMauritaniaMauritiusMexicoMicronesia, Fed. Sts.Middle East & North AfricaMiddle East & North Africa (excluding high income)Middle East & North Africa (IDA & IBRD countries)Middle incomeMoldovaMonacoMongoliaMontenegroMoroccoMozambiqueMyanmarNamibiaNepalNetherlandsNew CaledoniaNew ZealandNicaraguaNigerNigeriaNorth AmericaNorwayOECD membersOmanOther small statesPacific island small statesPakistanPalauPanamaPapua New GuineaParaguayPeruPhilippinesPolandPortugalPost-demographic dividendPre-demographic dividendPuerto RicoQatarRomaniaRussian FederationRwandaSamoaSan MarinoSao Tome and PrincipeSaudi ArabiaSenegalSerbiaSeychellesSierra LeoneSingaporeSlovak RepublicSloveniaSmall statesSolomon IslandsSomaliaSouth AfricaSouth AsiaSouth Asia (IDA & IBRD)South SudanSpainSri LankaSt. Kitts and NevisSt. LuciaSt. Vincent and the GrenadinesSub-Saharan Africa Sub-Saharan Africa (excluding high income)Sub-Saharan Africa (IDA & IBRD countries)SudanSurinameSwazilandSwedenSwitzerlandSyrian Arab RepublicTajikistanTanzaniaThailandTimor-LesteTogoTongaTrinidad and TobagoTunisiaTurkeyTurkmenistanTuvaluUgandaUkraineUnited Arab EmiratesUnited KingdomUnited StatesUpper middle incomeUruguayUzbekistanVanuatuVenezuela, RBVietnamVirgin Islands (U.S.)West Bank and GazaWorldYemen, Rep.ZambiaZimbabwe Timeline:
This timeline shows a graph from 1971 to 2015 of North America. No data until 1970. Number of actual observations by date: 45.
Source name:
World Development Indicators
Source organization:
World Bank staff estimates based on sources and methods in World Bank's "The Changing Wealth of Nations: Measuring Sustainable Development in the New Millennium" (2011).
Categories, topics:
Economy & Growth, Energy & Mining, Environment
Last updated:
apr 23, 2017
Indicators value changes by year
At the date of observation
Value
Absolute change
Change from previous value
jan 1, 1971
0.169
+0.169
0.0%
jan 1, 1972
0.108
-0.061
-35.96%
jan 1, 1973
0.102
-0.007
-6.11%
jan 1, 1974
0.206
+0.105
103.02%
jan 1, 1975
0.279
+0.073
35.29%
jan 1, 1976
0.154
-0.125
-44.91%
jan 1, 1977
0.115
-0.039
-25.08%
jan 1, 1978
0.084
-0.031
-27.19%
jan 1, 1979
0.056
-0.028
-33.04%
jan 1, 1980
0.102
+0.046
81.49%
jan 1, 1981
0.131
+0.029
28.86%
jan 1, 1982
0.083
-0.048
-36.57%
jan 1, 1983
0.048
-0.035
-42.18%
jan 1, 1984
0.052
+0.004
7.56%
jan 1, 1985
0.045
-0.007
-13.43%
jan 1, 1986
0.037
-0.008
-18.19%
jan 1, 1987
0.026
-0.01
-28.38%
jan 1, 1988
0.042
+0.015
58.85%
jan 1, 1989
0.133
+0.091
217.87%
jan 1, 1990
0.087
-0.046
-34.43%
jan 1, 1991
0.068
-0.019
-21.77%
jan 1, 1992
0.047
-0.021
-31.01%
jan 1, 1993
0.04
-0.007
-14.11%
jan 1, 1994
0.021
-0.019
-48.05%
jan 1, 1995
0.032
+0.012
55.04%
jan 1, 1996
0.044
+0.011
34.42%
jan 1, 1997
0.031
-0.013
-29.39%
jan 1, 1998
0.03
-0.001
-2.79%
jan 1, 1999
0.014
-0.016
-54.36%
jan 1, 2000
0.011
-0.002
-16.75%
jan 1, 2001
0.016
+0.005
42.17%
jan 1, 2002
0.01
-0.007
-40.38%
jan 1, 2003
0.011
+0.001
15.06%
jan 1, 2004
0.014
+0.003
29.94%
jan 1, 2005
0.029
+0.015
100.52%
jan 1, 2006
0.039
+0.01
35.59%
jan 1, 2007
0.095
+0.056
142.16%
jan 1, 2008
0.128
+0.033
34.91%
jan 1, 2009
0.144
+0.016
12.3%
jan 1, 2010
0.075
-0.069
-47.7%
jan 1, 2011
0.126
+0.051
67.7%
jan 1, 2012
0.159
+0.033
26.14%
jan 1, 2013
0.141
-0.018
-11.45%
jan 1, 2014
0.122
-0.019
-13.81%
jan 1, 2015
0.103
-0.019
-15.34%
Ranking of countries by current statistics by years


Comments: