29
/
en
AIzaSyAYiBZKx7MnpbEhh9jyipgxe19OcubqV5w
April 1, 2024
285476
Zambia
ZMB
true
2
1
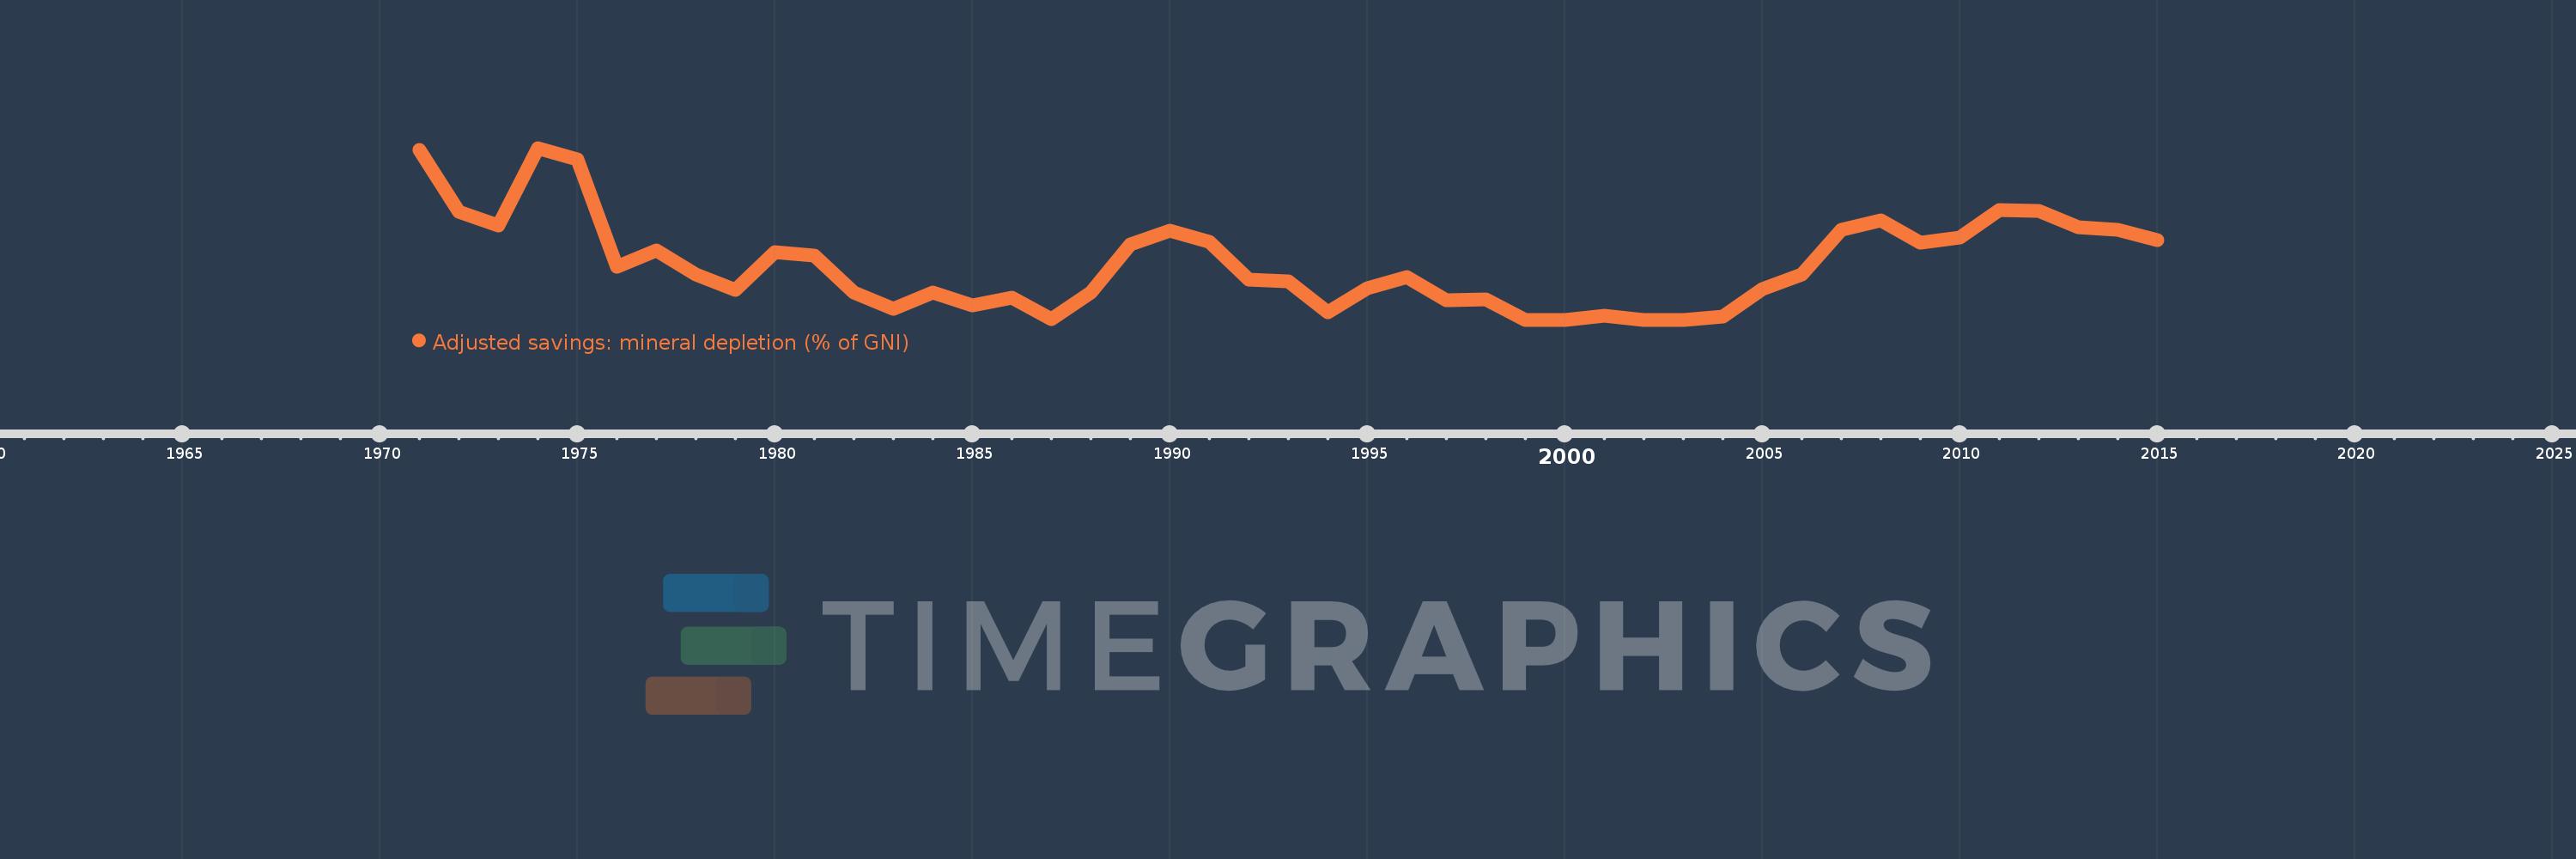
Adjusted savings: mineral depletion (% of GNI)
2015,2014,2013,2012,2011,2010,2009,2008,2007,2006,2005,2004,2003,2002,2001,2000,1999,1998,1997,1996,1995,1994,1993,1992,1991,1990,1989,1988,1987,1986,1985,1984,1983,1982,1981,1980,1979,1978,1977,1976,1975,1974,1973,1972,1971
This statistics in other country:
AfghanistanAlbaniaAlgeriaAmerican SamoaAndorraAngolaAntigua and BarbudaArab WorldArgentinaArmeniaAustraliaAustriaAzerbaijanBahamas, TheBahrainBangladeshBarbadosBelarusBelgiumBelizeBeninBermudaBhutanBoliviaBosnia and HerzegovinaBotswanaBrazilBrunei DarussalamBulgariaBurkina FasoBurundiCabo VerdeCambodiaCameroonCanadaCaribbean small statesCentral African RepublicCentral Europe and the BalticsChadChannel IslandsChileChinaColombiaComorosCongo, Dem. Rep.Congo, Rep.Costa RicaCote d'IvoireCroatiaCubaCyprusCzech RepublicDenmarkDjiboutiDominicaDominican RepublicEarly-demographic dividendEast Asia & PacificEast Asia & Pacific (excluding high income)East Asia & Pacific (IDA & IBRD countries)EcuadorEgypt, Arab Rep.El SalvadorEquatorial GuineaEritreaEstoniaEthiopiaEuro areaEurope & Central AsiaEurope & Central Asia (excluding high income)Europe & Central Asia (IDA & IBRD countries)European UnionFaroe IslandsFijiFinlandFragile and conflict affected situationsFranceFrench PolynesiaGabonGambia, TheGeorgiaGermanyGhanaGreeceGreenlandGrenadaGuatemalaGuineaGuinea-BissauGuyanaHaitiHeavily indebted poor countries (HIPC)High incomeHondurasHong Kong SAR, ChinaHungaryIBRD onlyIcelandIDA & IBRD totalIDA blendIDA onlyIDA totalIndiaIndonesiaIran, Islamic Rep.IraqIrelandIsle of ManIsraelItalyJamaicaJapanJordanKazakhstanKenyaKiribatiKorea, Rep.KosovoKuwaitKyrgyz RepublicLao PDRLate-demographic dividendLatin America & Caribbean Latin America & Caribbean (excluding high income)Latin America & the Caribbean (IDA & IBRD countries)LatviaLeast developed countries: UN classificationLebanonLesothoLiberiaLibyaLiechtensteinLithuaniaLow & middle incomeLow incomeLower middle incomeLuxembourgMacao SAR, ChinaMacedonia, FYRMadagascarMalawiMalaysiaMaldivesMaliMaltaMarshall IslandsMauritaniaMauritiusMexicoMicronesia, Fed. Sts.Middle East & North AfricaMiddle East & North Africa (excluding high income)Middle East & North Africa (IDA & IBRD countries)Middle incomeMoldovaMonacoMongoliaMontenegroMoroccoMozambiqueMyanmarNamibiaNepalNetherlandsNew CaledoniaNew ZealandNicaraguaNigerNigeriaNorth AmericaNorwayOECD membersOmanOther small statesPacific island small statesPakistanPalauPanamaPapua New GuineaParaguayPeruPhilippinesPolandPortugalPost-demographic dividendPre-demographic dividendPuerto RicoQatarRomaniaRussian FederationRwandaSamoaSan MarinoSao Tome and PrincipeSaudi ArabiaSenegalSerbiaSeychellesSierra LeoneSingaporeSlovak RepublicSloveniaSmall statesSolomon IslandsSomaliaSouth AfricaSouth AsiaSouth Asia (IDA & IBRD)South SudanSpainSri LankaSt. Kitts and NevisSt. LuciaSt. Vincent and the GrenadinesSub-Saharan Africa Sub-Saharan Africa (excluding high income)Sub-Saharan Africa (IDA & IBRD countries)SudanSurinameSwazilandSwedenSwitzerlandSyrian Arab RepublicTajikistanTanzaniaThailandTimor-LesteTogoTongaTrinidad and TobagoTunisiaTurkeyTurkmenistanTuvaluUgandaUkraineUnited Arab EmiratesUnited KingdomUnited StatesUpper middle incomeUruguayUzbekistanVanuatuVenezuela, RBVietnamVirgin Islands (U.S.)West Bank and GazaWorldYemen, Rep.ZambiaZimbabwe Timeline:
This timeline shows a graph from 1971 to 2015 of Zambia. No data until 1970. Number of actual observations by date: 45.
Source name:
World Development Indicators
Source organization:
World Bank staff estimates based on sources and methods in World Bank's "The Changing Wealth of Nations: Measuring Sustainable Development in the New Millennium" (2011).
Categories, topics:
Economy & Growth, Energy & Mining, Environment
Last updated:
apr 23, 2017
Indicators value changes by year
Maximum:
19.227
jan 1, 1974
At the date of observation
Value
Absolute change
Change from previous value
jan 1, 1971
18.96
+18.96
0.0%
jan 1, 1972
12.065
-6.895
-36.37%
jan 1, 1973
10.571
-1.494
-12.38%
jan 1, 1974
19.227
+8.655
81.88%
jan 1, 1975
17.915
-1.312
-6.82%
jan 1, 1976
5.894
-12.02
-67.1%
jan 1, 1977
7.771
+1.877
31.84%
jan 1, 1978
5.071
-2.701
-34.75%
jan 1, 1979
3.318
-1.752
-34.56%
jan 1, 1980
7.599
+4.281
129.01%
jan 1, 1981
7.213
-0.386
-5.09%
jan 1, 1982
3.028
-4.185
-58.02%
jan 1, 1983
1.252
-1.776
-58.64%
jan 1, 1984
3.054
+1.802
143.86%
jan 1, 1985
1.632
-1.422
-46.57%
jan 1, 1986
2.435
+0.804
49.24%
jan 1, 1987
0.052
-2.384
-97.88%
jan 1, 1988
3.086
+3.034
5.89K%
jan 1, 1989
8.445
+5.36
173.71%
jan 1, 1990
10.015
+1.57
18.59%
jan 1, 1991
8.739
-1.277
-12.75%
jan 1, 1992
4.497
-4.242
-48.54%
jan 1, 1993
4.254
-0.243
-5.4%
jan 1, 1994
0.809
-3.446
-80.99%
jan 1, 1995
3.491
+2.682
331.69%
jan 1, 1996
4.77
+1.28
36.66%
jan 1, 1997
2.213
-2.557
-53.61%
jan 1, 1998
2.325
+0.113
5.09%
jan 1, 1999
0.0
-2.325
-100.0%
jan 1, 2001
0.494
+0.494
%
jan 1, 2002
0.0
-0.494
-100.0%
jan 1, 2004
0.357
+0.357
%
jan 1, 2005
3.461
+3.103
868.1%
jan 1, 2006
5.04
+1.579
45.63%
jan 1, 2007
10.077
+5.037
99.94%
jan 1, 2008
11.098
+1.021
10.13%
jan 1, 2009
8.639
-2.458
-22.15%
jan 1, 2010
9.242
+0.602
6.97%
jan 1, 2011
12.309
+3.068
33.19%
jan 1, 2012
12.177
-0.132
-1.08%
jan 1, 2013
10.32
-1.856
-15.25%
jan 1, 2014
10.045
-0.275
-2.67%
jan 1, 2015
8.883
-1.163
-11.57%
Ranking of countries by current statistics by years


Comments: