29
/
en
AIzaSyAYiBZKx7MnpbEhh9jyipgxe19OcubqV5w
April 1, 2024
26269
Early-demographic dividend
EAR
false
2
1
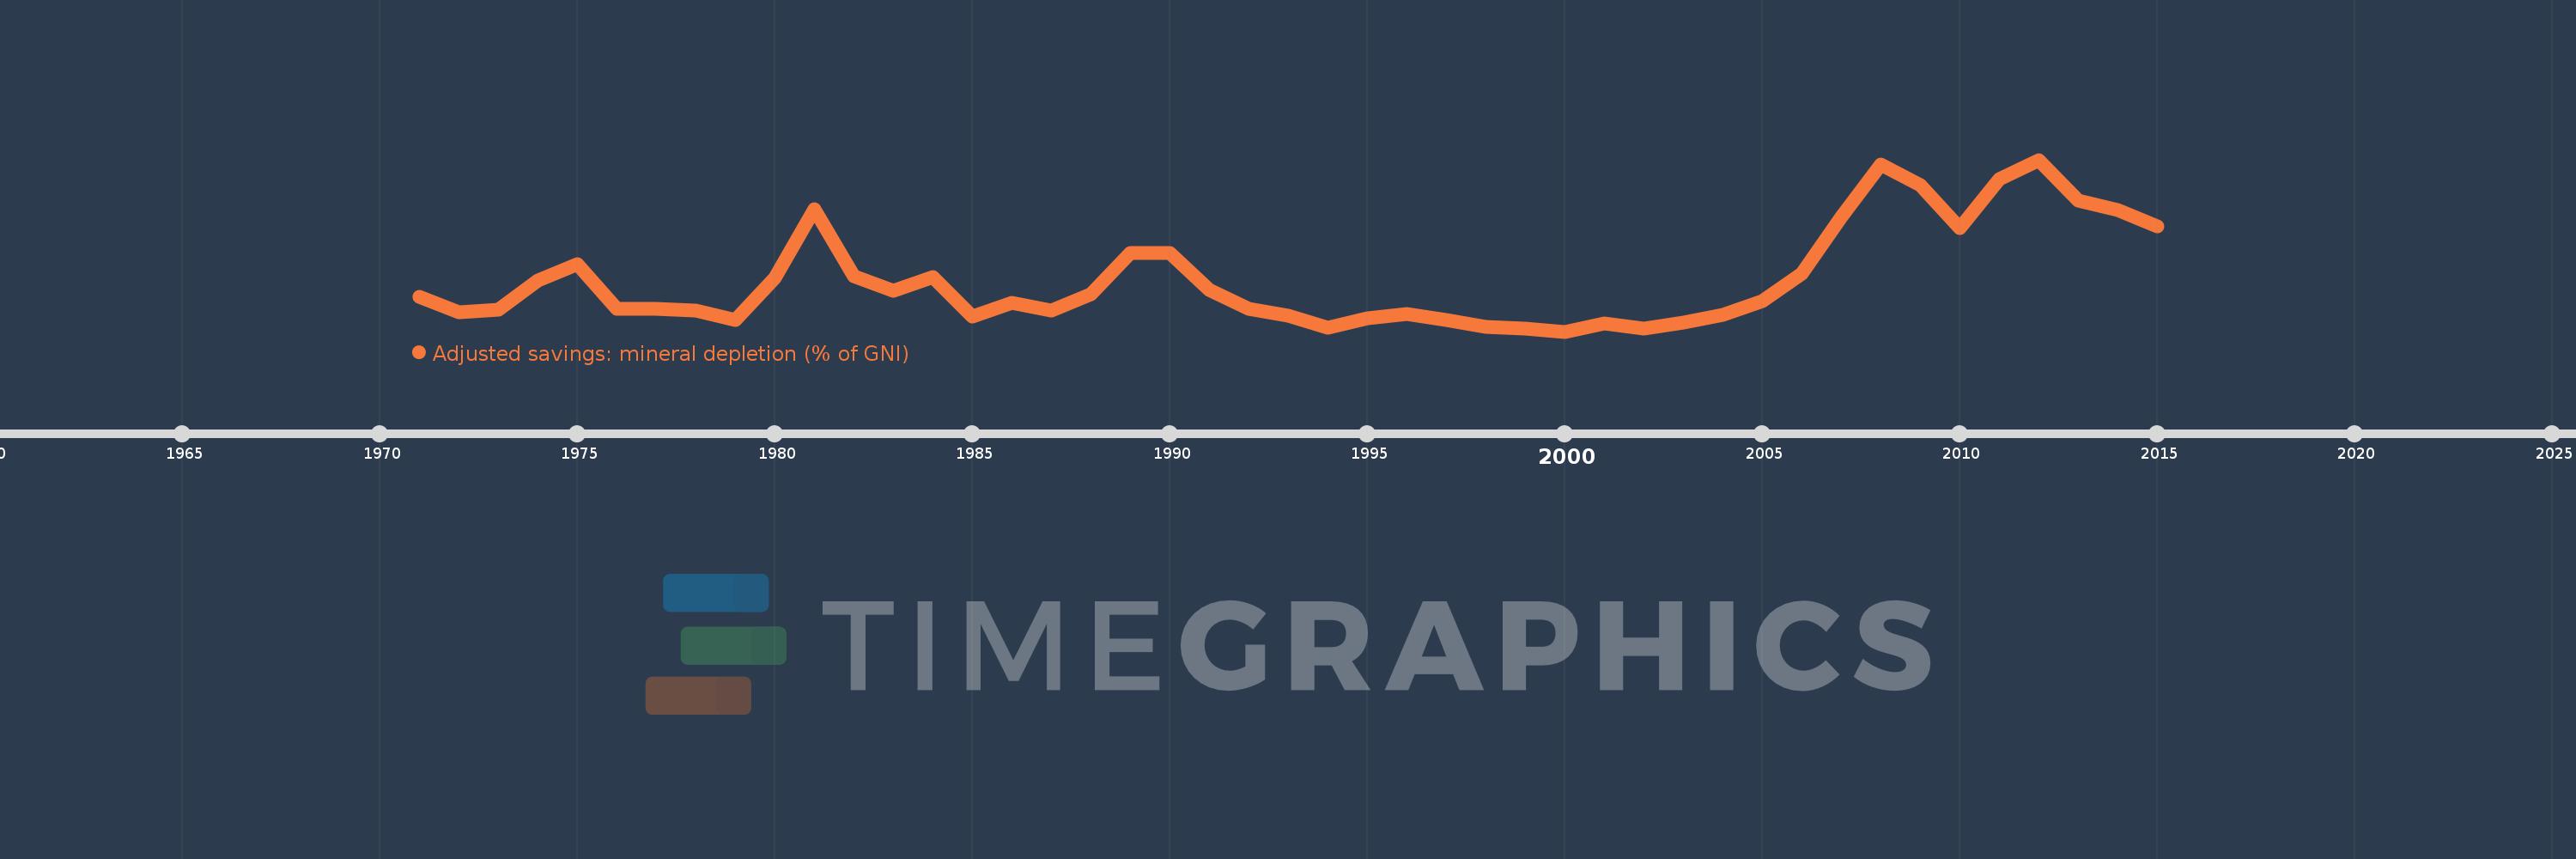
Adjusted savings: mineral depletion (% of GNI)
2015,2014,2013,2012,2011,2010,2009,2008,2007,2006,2005,2004,2003,2002,2001,2000,1999,1998,1997,1996,1995,1994,1993,1992,1991,1990,1989,1988,1987,1986,1985,1984,1983,1982,1981,1980,1979,1978,1977,1976,1975,1974,1973,1972,1971
This statistics in other country:
AfghanistanAlbaniaAlgeriaAmerican SamoaAndorraAngolaAntigua and BarbudaArab WorldArgentinaArmeniaAustraliaAustriaAzerbaijanBahamas, TheBahrainBangladeshBarbadosBelarusBelgiumBelizeBeninBermudaBhutanBoliviaBosnia and HerzegovinaBotswanaBrazilBrunei DarussalamBulgariaBurkina FasoBurundiCabo VerdeCambodiaCameroonCanadaCaribbean small statesCentral African RepublicCentral Europe and the BalticsChadChannel IslandsChileChinaColombiaComorosCongo, Dem. Rep.Congo, Rep.Costa RicaCote d'IvoireCroatiaCubaCyprusCzech RepublicDenmarkDjiboutiDominicaDominican RepublicEarly-demographic dividendEast Asia & PacificEast Asia & Pacific (excluding high income)East Asia & Pacific (IDA & IBRD countries)EcuadorEgypt, Arab Rep.El SalvadorEquatorial GuineaEritreaEstoniaEthiopiaEuro areaEurope & Central AsiaEurope & Central Asia (excluding high income)Europe & Central Asia (IDA & IBRD countries)European UnionFaroe IslandsFijiFinlandFragile and conflict affected situationsFranceFrench PolynesiaGabonGambia, TheGeorgiaGermanyGhanaGreeceGreenlandGrenadaGuatemalaGuineaGuinea-BissauGuyanaHaitiHeavily indebted poor countries (HIPC)High incomeHondurasHong Kong SAR, ChinaHungaryIBRD onlyIcelandIDA & IBRD totalIDA blendIDA onlyIDA totalIndiaIndonesiaIran, Islamic Rep.IraqIrelandIsle of ManIsraelItalyJamaicaJapanJordanKazakhstanKenyaKiribatiKorea, Rep.KosovoKuwaitKyrgyz RepublicLao PDRLate-demographic dividendLatin America & Caribbean Latin America & Caribbean (excluding high income)Latin America & the Caribbean (IDA & IBRD countries)LatviaLeast developed countries: UN classificationLebanonLesothoLiberiaLibyaLiechtensteinLithuaniaLow & middle incomeLow incomeLower middle incomeLuxembourgMacao SAR, ChinaMacedonia, FYRMadagascarMalawiMalaysiaMaldivesMaliMaltaMarshall IslandsMauritaniaMauritiusMexicoMicronesia, Fed. Sts.Middle East & North AfricaMiddle East & North Africa (excluding high income)Middle East & North Africa (IDA & IBRD countries)Middle incomeMoldovaMonacoMongoliaMontenegroMoroccoMozambiqueMyanmarNamibiaNepalNetherlandsNew CaledoniaNew ZealandNicaraguaNigerNigeriaNorth AmericaNorwayOECD membersOmanOther small statesPacific island small statesPakistanPalauPanamaPapua New GuineaParaguayPeruPhilippinesPolandPortugalPost-demographic dividendPre-demographic dividendPuerto RicoQatarRomaniaRussian FederationRwandaSamoaSan MarinoSao Tome and PrincipeSaudi ArabiaSenegalSerbiaSeychellesSierra LeoneSingaporeSlovak RepublicSloveniaSmall statesSolomon IslandsSomaliaSouth AfricaSouth AsiaSouth Asia (IDA & IBRD)South SudanSpainSri LankaSt. Kitts and NevisSt. LuciaSt. Vincent and the GrenadinesSub-Saharan Africa Sub-Saharan Africa (excluding high income)Sub-Saharan Africa (IDA & IBRD countries)SudanSurinameSwazilandSwedenSwitzerlandSyrian Arab RepublicTajikistanTanzaniaThailandTimor-LesteTogoTongaTrinidad and TobagoTunisiaTurkeyTurkmenistanTuvaluUgandaUkraineUnited Arab EmiratesUnited KingdomUnited StatesUpper middle incomeUruguayUzbekistanVanuatuVenezuela, RBVietnamVirgin Islands (U.S.)West Bank and GazaWorldYemen, Rep.ZambiaZimbabwe Timeline:
This timeline shows a graph from 1971 to 2015 of Early-demographic dividend. No data until 1970. Number of actual observations by date: 45.
Source name:
World Development Indicators
Source organization:
World Bank staff estimates based on sources and methods in World Bank's "The Changing Wealth of Nations: Measuring Sustainable Development in the New Millennium" (2011).
Categories, topics:
Economy & Growth, Energy & Mining, Environment
Last updated:
apr 23, 2017
Indicators value changes by year
At the date of observation
Value
Absolute change
Change from previous value
jan 1, 1971
0.251
+0.251
0.0%
jan 1, 1972
0.18
-0.071
-28.21%
jan 1, 1973
0.194
+0.014
7.72%
jan 1, 1974
0.328
+0.134
69.0%
jan 1, 1975
0.402
+0.073
22.3%
jan 1, 1976
0.199
-0.203
-50.44%
jan 1, 1977
0.199
0.0
-0.23%
jan 1, 1978
0.188
-0.01
-5.18%
jan 1, 1979
0.147
-0.041
-21.94%
jan 1, 1980
0.337
+0.19
129.24%
jan 1, 1981
0.652
+0.315
93.38%
jan 1, 1982
0.347
-0.305
-46.82%
jan 1, 1983
0.279
-0.068
-19.58%
jan 1, 1984
0.341
+0.062
22.24%
jan 1, 1985
0.161
-0.179
-52.6%
jan 1, 1986
0.226
+0.065
40.23%
jan 1, 1987
0.191
-0.035
-15.54%
jan 1, 1988
0.262
+0.071
37.01%
jan 1, 1989
0.453
+0.191
72.8%
jan 1, 1990
0.454
+0.002
0.33%
jan 1, 1991
0.284
-0.17
-37.38%
jan 1, 1992
0.199
-0.085
-29.99%
jan 1, 1993
0.164
-0.035
-17.68%
jan 1, 1994
0.109
-0.055
-33.79%
jan 1, 1995
0.152
+0.043
39.8%
jan 1, 1996
0.173
+0.021
14.06%
jan 1, 1997
0.145
-0.028
-16.24%
jan 1, 1998
0.116
-0.029
-20.09%
jan 1, 1999
0.108
-0.008
-6.64%
jan 1, 2000
0.093
-0.015
-13.98%
jan 1, 2001
0.13
+0.037
40.03%
jan 1, 2002
0.108
-0.022
-16.86%
jan 1, 2003
0.135
+0.027
25.03%
jan 1, 2004
0.169
+0.033
24.51%
jan 1, 2005
0.233
+0.064
38.17%
jan 1, 2006
0.36
+0.127
54.4%
jan 1, 2007
0.616
+0.257
71.35%
jan 1, 2008
0.858
+0.242
39.24%
jan 1, 2009
0.762
-0.097
-11.26%
jan 1, 2010
0.565
-0.197
-25.84%
jan 1, 2011
0.79
+0.226
39.93%
jan 1, 2012
0.879
+0.089
11.26%
jan 1, 2013
0.692
-0.187
-21.31%
jan 1, 2014
0.649
-0.043
-6.15%
jan 1, 2015
0.574
-0.076
-11.64%
Ranking of countries by current statistics by years


Comments: