29
/
en
AIzaSyAYiBZKx7MnpbEhh9jyipgxe19OcubqV5w
April 1, 2024
32361
Europe & Central Asia (IDA & IBRD countries)
TEC
false
2
1
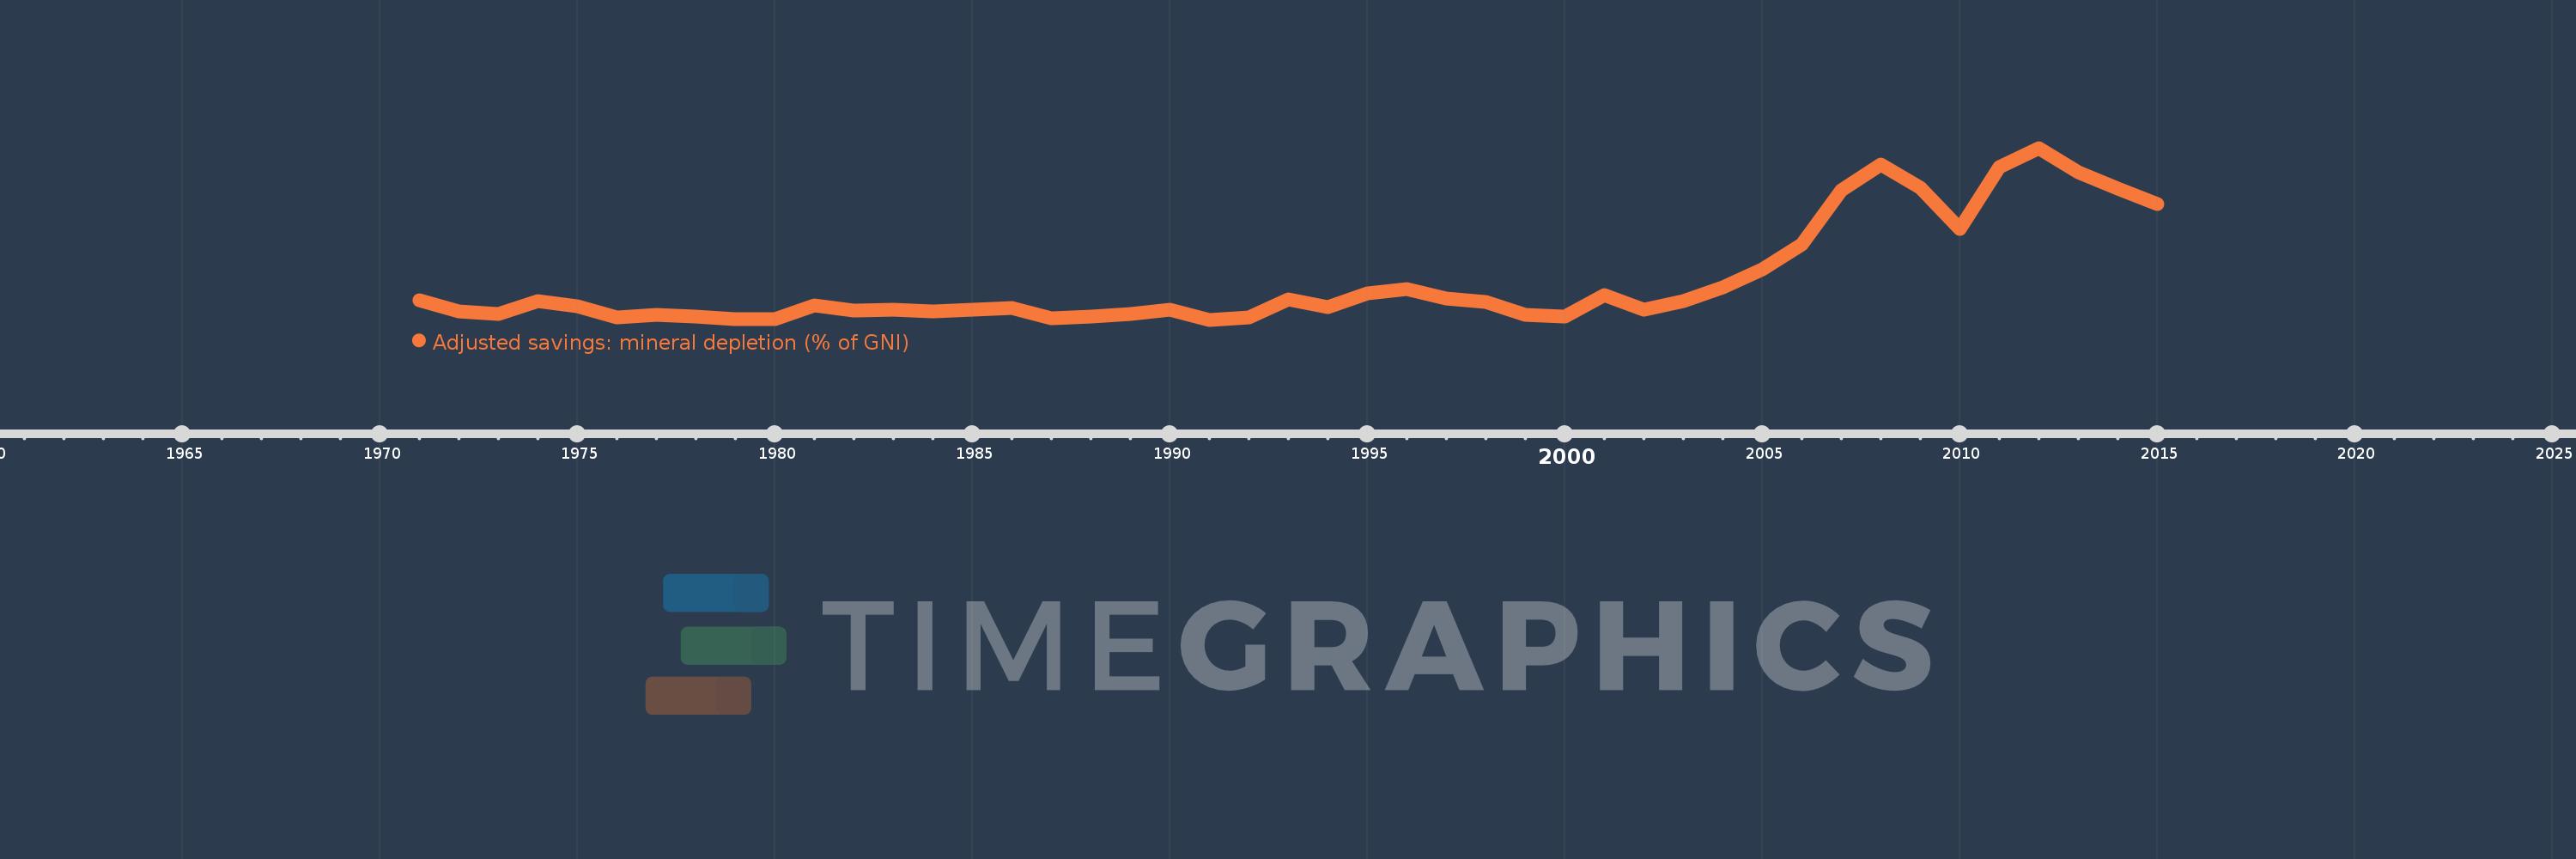
Adjusted savings: mineral depletion (% of GNI)
2015,2014,2013,2012,2011,2010,2009,2008,2007,2006,2005,2004,2003,2002,2001,2000,1999,1998,1997,1996,1995,1994,1993,1992,1991,1990,1989,1988,1987,1986,1985,1984,1983,1982,1981,1980,1979,1978,1977,1976,1975,1974,1973,1972,1971
This statistics in other country:
AfghanistanAlbaniaAlgeriaAmerican SamoaAndorraAngolaAntigua and BarbudaArab WorldArgentinaArmeniaAustraliaAustriaAzerbaijanBahamas, TheBahrainBangladeshBarbadosBelarusBelgiumBelizeBeninBermudaBhutanBoliviaBosnia and HerzegovinaBotswanaBrazilBrunei DarussalamBulgariaBurkina FasoBurundiCabo VerdeCambodiaCameroonCanadaCaribbean small statesCentral African RepublicCentral Europe and the BalticsChadChannel IslandsChileChinaColombiaComorosCongo, Dem. Rep.Congo, Rep.Costa RicaCote d'IvoireCroatiaCubaCyprusCzech RepublicDenmarkDjiboutiDominicaDominican RepublicEarly-demographic dividendEast Asia & PacificEast Asia & Pacific (excluding high income)East Asia & Pacific (IDA & IBRD countries)EcuadorEgypt, Arab Rep.El SalvadorEquatorial GuineaEritreaEstoniaEthiopiaEuro areaEurope & Central AsiaEurope & Central Asia (excluding high income)Europe & Central Asia (IDA & IBRD countries)European UnionFaroe IslandsFijiFinlandFragile and conflict affected situationsFranceFrench PolynesiaGabonGambia, TheGeorgiaGermanyGhanaGreeceGreenlandGrenadaGuatemalaGuineaGuinea-BissauGuyanaHaitiHeavily indebted poor countries (HIPC)High incomeHondurasHong Kong SAR, ChinaHungaryIBRD onlyIcelandIDA & IBRD totalIDA blendIDA onlyIDA totalIndiaIndonesiaIran, Islamic Rep.IraqIrelandIsle of ManIsraelItalyJamaicaJapanJordanKazakhstanKenyaKiribatiKorea, Rep.KosovoKuwaitKyrgyz RepublicLao PDRLate-demographic dividendLatin America & Caribbean Latin America & Caribbean (excluding high income)Latin America & the Caribbean (IDA & IBRD countries)LatviaLeast developed countries: UN classificationLebanonLesothoLiberiaLibyaLiechtensteinLithuaniaLow & middle incomeLow incomeLower middle incomeLuxembourgMacao SAR, ChinaMacedonia, FYRMadagascarMalawiMalaysiaMaldivesMaliMaltaMarshall IslandsMauritaniaMauritiusMexicoMicronesia, Fed. Sts.Middle East & North AfricaMiddle East & North Africa (excluding high income)Middle East & North Africa (IDA & IBRD countries)Middle incomeMoldovaMonacoMongoliaMontenegroMoroccoMozambiqueMyanmarNamibiaNepalNetherlandsNew CaledoniaNew ZealandNicaraguaNigerNigeriaNorth AmericaNorwayOECD membersOmanOther small statesPacific island small statesPakistanPalauPanamaPapua New GuineaParaguayPeruPhilippinesPolandPortugalPost-demographic dividendPre-demographic dividendPuerto RicoQatarRomaniaRussian FederationRwandaSamoaSan MarinoSao Tome and PrincipeSaudi ArabiaSenegalSerbiaSeychellesSierra LeoneSingaporeSlovak RepublicSloveniaSmall statesSolomon IslandsSomaliaSouth AfricaSouth AsiaSouth Asia (IDA & IBRD)South SudanSpainSri LankaSt. Kitts and NevisSt. LuciaSt. Vincent and the GrenadinesSub-Saharan Africa Sub-Saharan Africa (excluding high income)Sub-Saharan Africa (IDA & IBRD countries)SudanSurinameSwazilandSwedenSwitzerlandSyrian Arab RepublicTajikistanTanzaniaThailandTimor-LesteTogoTongaTrinidad and TobagoTunisiaTurkeyTurkmenistanTuvaluUgandaUkraineUnited Arab EmiratesUnited KingdomUnited StatesUpper middle incomeUruguayUzbekistanVanuatuVenezuela, RBVietnamVirgin Islands (U.S.)West Bank and GazaWorldYemen, Rep.ZambiaZimbabwe Timeline:
This timeline shows a graph from 1971 to 2015 of Europe & Central Asia (IDA & IBRD countries). No data until 1970. Number of actual observations by date: 45.
Source name:
World Development Indicators
Source organization:
World Bank staff estimates based on sources and methods in World Bank's "The Changing Wealth of Nations: Measuring Sustainable Development in the New Millennium" (2011).
Categories, topics:
Economy & Growth, Energy & Mining, Environment
Last updated:
apr 23, 2017
Indicators value changes by year
At the date of observation
Value
Absolute change
Change from previous value
jan 1, 1971
0.119
+0.119
0.0%
jan 1, 1972
0.064
-0.054
-45.75%
jan 1, 1973
0.05
-0.014
-21.64%
jan 1, 1974
0.115
+0.064
127.85%
jan 1, 1975
0.09
-0.025
-22.02%
jan 1, 1976
0.036
-0.053
-59.34%
jan 1, 1977
0.046
+0.01
27.48%
jan 1, 1978
0.037
-0.01
-20.74%
jan 1, 1979
0.025
-0.012
-32.25%
jan 1, 1980
0.027
+0.002
6.76%
jan 1, 1981
0.093
+0.067
250.03%
jan 1, 1982
0.067
-0.026
-27.85%
jan 1, 1983
0.071
+0.004
5.4%
jan 1, 1984
0.063
-0.007
-10.37%
jan 1, 1985
0.071
+0.007
11.14%
jan 1, 1986
0.079
+0.008
11.77%
jan 1, 1987
0.031
-0.048
-61.15%
jan 1, 1988
0.038
+0.007
22.65%
jan 1, 1989
0.053
+0.015
39.85%
jan 1, 1990
0.073
+0.02
38.19%
jan 1, 1991
0.023
-0.05
-68.68%
jan 1, 1992
0.034
+0.011
48.4%
jan 1, 1993
0.122
+0.088
260.11%
jan 1, 1994
0.084
-0.038
-31.15%
jan 1, 1995
0.152
+0.068
81.15%
jan 1, 1996
0.174
+0.023
15.01%
jan 1, 1997
0.128
-0.047
-26.72%
jan 1, 1998
0.11
-0.018
-13.87%
jan 1, 1999
0.047
-0.063
-57.0%
jan 1, 2000
0.04
-0.007
-15.26%
jan 1, 2001
0.145
+0.105
260.94%
jan 1, 2002
0.07
-0.075
-51.52%
jan 1, 2003
0.115
+0.044
63.41%
jan 1, 2004
0.182
+0.068
58.97%
jan 1, 2005
0.27
+0.088
48.09%
jan 1, 2006
0.39
+0.12
44.63%
jan 1, 2007
0.652
+0.262
67.08%
jan 1, 2008
0.779
+0.127
19.43%
jan 1, 2009
0.668
-0.111
-14.24%
jan 1, 2010
0.466
-0.203
-30.32%
jan 1, 2011
0.765
+0.299
64.27%
jan 1, 2012
0.86
+0.095
12.45%
jan 1, 2013
0.741
-0.119
-13.88%
jan 1, 2014
0.663
-0.077
-10.43%
jan 1, 2015
0.585
-0.078
-11.81%
Ranking of countries by current statistics by years


Comments: