29
/
en
AIzaSyAYiBZKx7MnpbEhh9jyipgxe19OcubqV5w
April 1, 2024
219268
Papua New Guinea
PNG
true
2
1
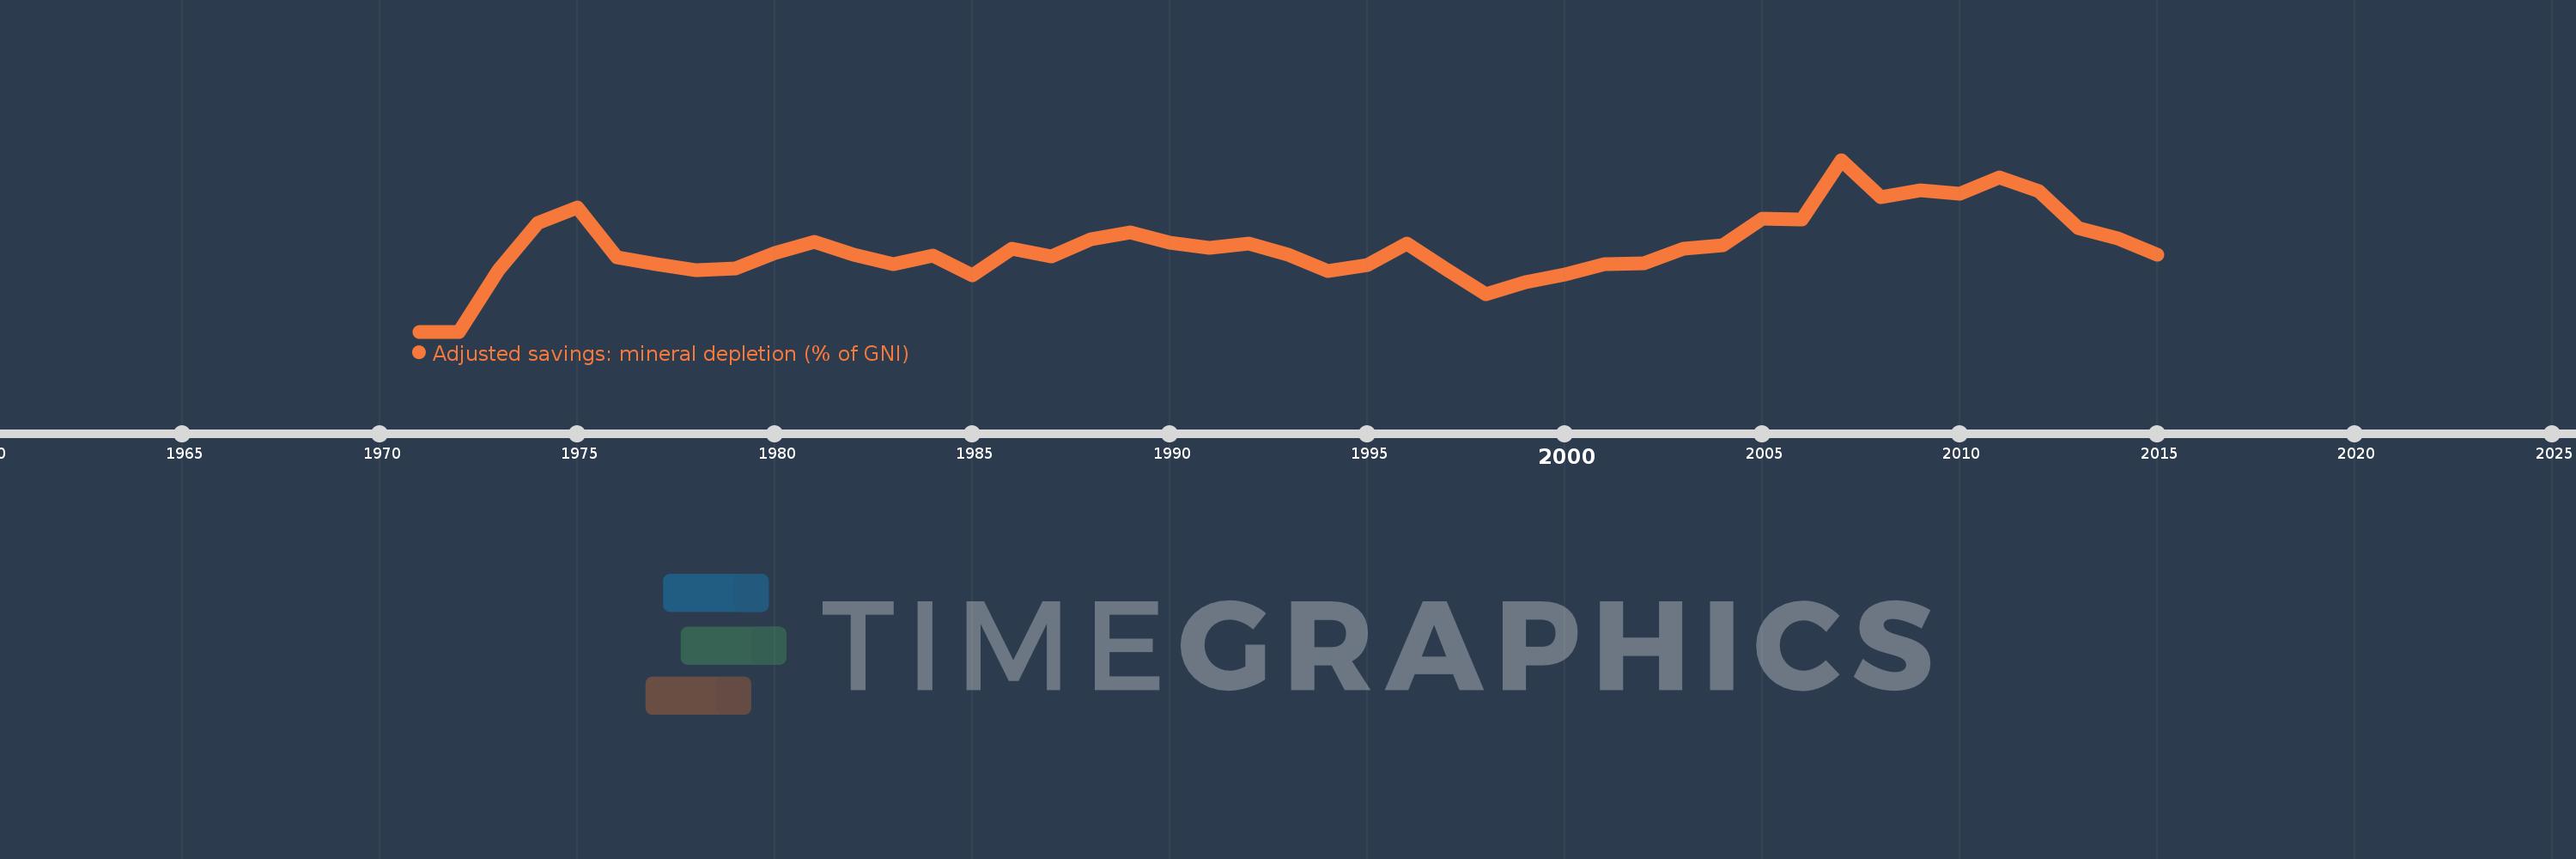
Adjusted savings: mineral depletion (% of GNI)
2015,2014,2013,2012,2011,2010,2009,2008,2007,2006,2005,2004,2003,2002,2001,2000,1999,1998,1997,1996,1995,1994,1993,1992,1991,1990,1989,1988,1987,1986,1985,1984,1983,1982,1981,1980,1979,1978,1977,1976,1975,1974,1973,1972,1971
This statistics in other country:
AfghanistanAlbaniaAlgeriaAmerican SamoaAndorraAngolaAntigua and BarbudaArab WorldArgentinaArmeniaAustraliaAustriaAzerbaijanBahamas, TheBahrainBangladeshBarbadosBelarusBelgiumBelizeBeninBermudaBhutanBoliviaBosnia and HerzegovinaBotswanaBrazilBrunei DarussalamBulgariaBurkina FasoBurundiCabo VerdeCambodiaCameroonCanadaCaribbean small statesCentral African RepublicCentral Europe and the BalticsChadChannel IslandsChileChinaColombiaComorosCongo, Dem. Rep.Congo, Rep.Costa RicaCote d'IvoireCroatiaCubaCyprusCzech RepublicDenmarkDjiboutiDominicaDominican RepublicEarly-demographic dividendEast Asia & PacificEast Asia & Pacific (excluding high income)East Asia & Pacific (IDA & IBRD countries)EcuadorEgypt, Arab Rep.El SalvadorEquatorial GuineaEritreaEstoniaEthiopiaEuro areaEurope & Central AsiaEurope & Central Asia (excluding high income)Europe & Central Asia (IDA & IBRD countries)European UnionFaroe IslandsFijiFinlandFragile and conflict affected situationsFranceFrench PolynesiaGabonGambia, TheGeorgiaGermanyGhanaGreeceGreenlandGrenadaGuatemalaGuineaGuinea-BissauGuyanaHaitiHeavily indebted poor countries (HIPC)High incomeHondurasHong Kong SAR, ChinaHungaryIBRD onlyIcelandIDA & IBRD totalIDA blendIDA onlyIDA totalIndiaIndonesiaIran, Islamic Rep.IraqIrelandIsle of ManIsraelItalyJamaicaJapanJordanKazakhstanKenyaKiribatiKorea, Rep.KosovoKuwaitKyrgyz RepublicLao PDRLate-demographic dividendLatin America & Caribbean Latin America & Caribbean (excluding high income)Latin America & the Caribbean (IDA & IBRD countries)LatviaLeast developed countries: UN classificationLebanonLesothoLiberiaLibyaLiechtensteinLithuaniaLow & middle incomeLow incomeLower middle incomeLuxembourgMacao SAR, ChinaMacedonia, FYRMadagascarMalawiMalaysiaMaldivesMaliMaltaMarshall IslandsMauritaniaMauritiusMexicoMicronesia, Fed. Sts.Middle East & North AfricaMiddle East & North Africa (excluding high income)Middle East & North Africa (IDA & IBRD countries)Middle incomeMoldovaMonacoMongoliaMontenegroMoroccoMozambiqueMyanmarNamibiaNepalNetherlandsNew CaledoniaNew ZealandNicaraguaNigerNigeriaNorth AmericaNorwayOECD membersOmanOther small statesPacific island small statesPakistanPalauPanamaPapua New GuineaParaguayPeruPhilippinesPolandPortugalPost-demographic dividendPre-demographic dividendPuerto RicoQatarRomaniaRussian FederationRwandaSamoaSan MarinoSao Tome and PrincipeSaudi ArabiaSenegalSerbiaSeychellesSierra LeoneSingaporeSlovak RepublicSloveniaSmall statesSolomon IslandsSomaliaSouth AfricaSouth AsiaSouth Asia (IDA & IBRD)South SudanSpainSri LankaSt. Kitts and NevisSt. LuciaSt. Vincent and the GrenadinesSub-Saharan Africa Sub-Saharan Africa (excluding high income)Sub-Saharan Africa (IDA & IBRD countries)SudanSurinameSwazilandSwedenSwitzerlandSyrian Arab RepublicTajikistanTanzaniaThailandTimor-LesteTogoTongaTrinidad and TobagoTunisiaTurkeyTurkmenistanTuvaluUgandaUkraineUnited Arab EmiratesUnited KingdomUnited StatesUpper middle incomeUruguayUzbekistanVanuatuVenezuela, RBVietnamVirgin Islands (U.S.)West Bank and GazaWorldYemen, Rep.ZambiaZimbabwe Timeline:
This timeline shows a graph from 1971 to 2015 of Papua New Guinea. No data until 1970. Number of actual observations by date: 45.
Source name:
World Development Indicators
Source organization:
World Bank staff estimates based on sources and methods in World Bank's "The Changing Wealth of Nations: Measuring Sustainable Development in the New Millennium" (2011).
Categories, topics:
Economy & Growth, Energy & Mining, Environment
Last updated:
apr 23, 2017
Indicators value changes by year
Maximum:
23.845
jan 1, 2007
At the date of observation
Value
Absolute change
Change from previous value
jan 1, 1973
8.495
+8.495
%
jan 1, 1974
15.077
+6.582
77.49%
jan 1, 1975
17.205
+2.129
14.12%
jan 1, 1976
10.259
-6.947
-40.38%
jan 1, 1977
9.322
-0.937
-9.13%
jan 1, 1978
8.582
-0.739
-7.93%
jan 1, 1979
8.728
+0.146
1.7%
jan 1, 1980
10.917
+2.188
25.07%
jan 1, 1981
12.446
+1.529
14.01%
jan 1, 1982
10.664
-1.782
-14.32%
jan 1, 1983
9.35
-1.314
-12.32%
jan 1, 1984
10.546
+1.196
12.79%
jan 1, 1985
7.793
-2.752
-26.1%
jan 1, 1986
11.547
+3.753
48.16%
jan 1, 1987
10.377
-1.17
-10.14%
jan 1, 1988
12.8
+2.423
23.36%
jan 1, 1989
13.777
+0.977
7.63%
jan 1, 1990
12.398
-1.379
-10.01%
jan 1, 1991
11.596
-0.801
-6.46%
jan 1, 1992
12.178
+0.581
5.01%
jan 1, 1993
10.654
-1.524
-12.51%
jan 1, 1994
8.438
-2.216
-20.8%
jan 1, 1995
9.211
+0.773
9.16%
jan 1, 1996
12.211
+3.0
32.56%
jan 1, 1997
8.64
-3.571
-29.24%
jan 1, 1998
5.206
-3.434
-39.75%
jan 1, 1999
6.9
+1.694
32.54%
jan 1, 2000
7.871
+0.971
14.07%
jan 1, 2001
9.318
+1.447
18.39%
jan 1, 2002
9.447
+0.129
1.39%
jan 1, 2003
11.464
+2.017
21.35%
jan 1, 2004
12.014
+0.55
4.8%
jan 1, 2005
15.695
+3.681
30.64%
jan 1, 2006
15.613
-0.081
-0.52%
jan 1, 2007
23.845
+8.231
52.72%
jan 1, 2008
18.655
-5.19
-21.77%
jan 1, 2009
19.644
+0.989
5.3%
jan 1, 2010
19.153
-0.49
-2.5%
jan 1, 2011
21.454
+2.301
12.01%
jan 1, 2012
19.456
-1.998
-9.31%
jan 1, 2013
14.326
-5.13
-26.37%
jan 1, 2014
12.884
-1.442
-10.06%
jan 1, 2015
10.708
-2.176
-16.89%
Ranking of countries by current statistics by years


Comments: