29
/
en
AIzaSyAYiBZKx7MnpbEhh9jyipgxe19OcubqV5w
April 1, 2024
48696
Middle East & North Africa (excluding high income)
MNA
false
2
1
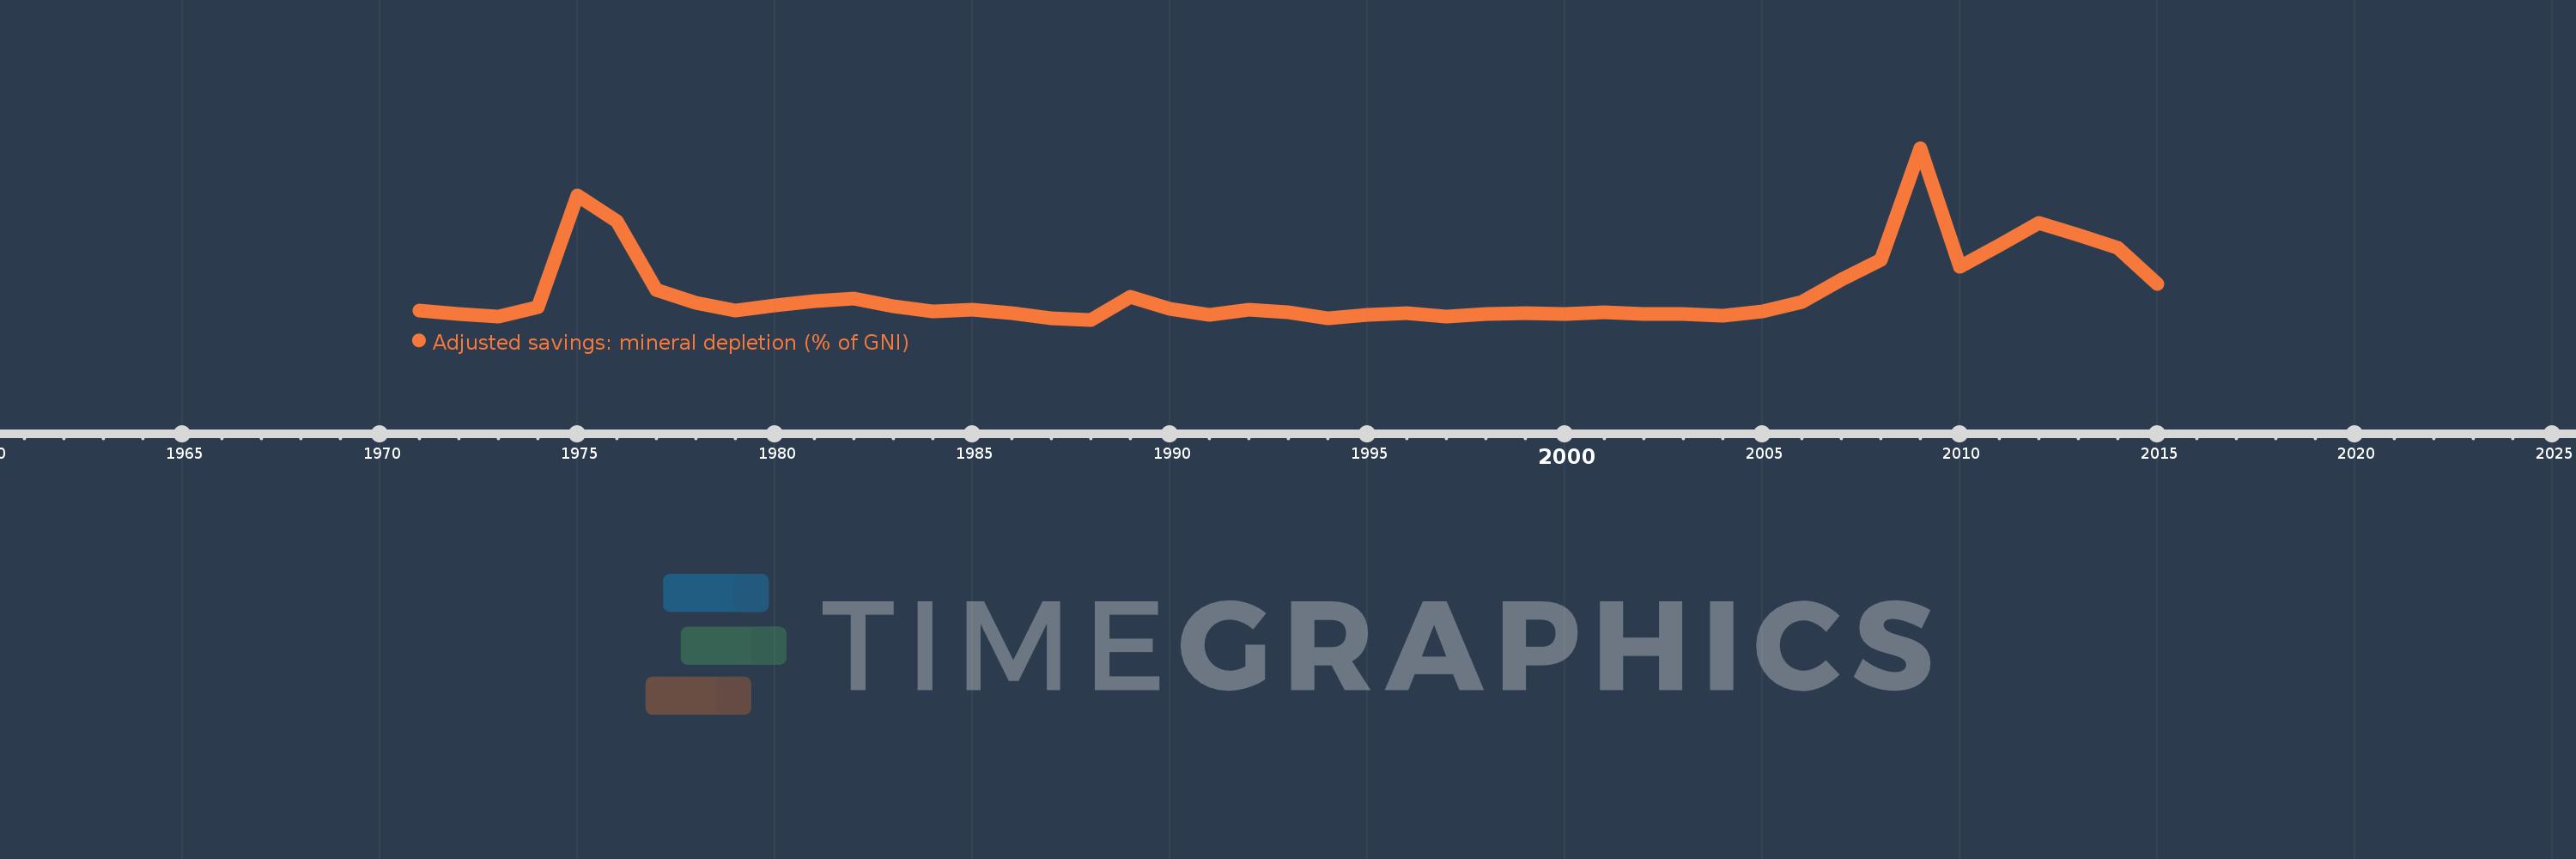
Adjusted savings: mineral depletion (% of GNI)
2015,2014,2013,2012,2011,2010,2009,2008,2007,2006,2005,2004,2003,2002,2001,2000,1999,1998,1997,1996,1995,1994,1993,1992,1991,1990,1989,1988,1987,1986,1985,1984,1983,1982,1981,1980,1979,1978,1977,1976,1975,1974,1973,1972,1971
This statistics in other country:
AfghanistanAlbaniaAlgeriaAmerican SamoaAndorraAngolaAntigua and BarbudaArab WorldArgentinaArmeniaAustraliaAustriaAzerbaijanBahamas, TheBahrainBangladeshBarbadosBelarusBelgiumBelizeBeninBermudaBhutanBoliviaBosnia and HerzegovinaBotswanaBrazilBrunei DarussalamBulgariaBurkina FasoBurundiCabo VerdeCambodiaCameroonCanadaCaribbean small statesCentral African RepublicCentral Europe and the BalticsChadChannel IslandsChileChinaColombiaComorosCongo, Dem. Rep.Congo, Rep.Costa RicaCote d'IvoireCroatiaCubaCyprusCzech RepublicDenmarkDjiboutiDominicaDominican RepublicEarly-demographic dividendEast Asia & PacificEast Asia & Pacific (excluding high income)East Asia & Pacific (IDA & IBRD countries)EcuadorEgypt, Arab Rep.El SalvadorEquatorial GuineaEritreaEstoniaEthiopiaEuro areaEurope & Central AsiaEurope & Central Asia (excluding high income)Europe & Central Asia (IDA & IBRD countries)European UnionFaroe IslandsFijiFinlandFragile and conflict affected situationsFranceFrench PolynesiaGabonGambia, TheGeorgiaGermanyGhanaGreeceGreenlandGrenadaGuatemalaGuineaGuinea-BissauGuyanaHaitiHeavily indebted poor countries (HIPC)High incomeHondurasHong Kong SAR, ChinaHungaryIBRD onlyIcelandIDA & IBRD totalIDA blendIDA onlyIDA totalIndiaIndonesiaIran, Islamic Rep.IraqIrelandIsle of ManIsraelItalyJamaicaJapanJordanKazakhstanKenyaKiribatiKorea, Rep.KosovoKuwaitKyrgyz RepublicLao PDRLate-demographic dividendLatin America & Caribbean Latin America & Caribbean (excluding high income)Latin America & the Caribbean (IDA & IBRD countries)LatviaLeast developed countries: UN classificationLebanonLesothoLiberiaLibyaLiechtensteinLithuaniaLow & middle incomeLow incomeLower middle incomeLuxembourgMacao SAR, ChinaMacedonia, FYRMadagascarMalawiMalaysiaMaldivesMaliMaltaMarshall IslandsMauritaniaMauritiusMexicoMicronesia, Fed. Sts.Middle East & North AfricaMiddle East & North Africa (excluding high income)Middle East & North Africa (IDA & IBRD countries)Middle incomeMoldovaMonacoMongoliaMontenegroMoroccoMozambiqueMyanmarNamibiaNepalNetherlandsNew CaledoniaNew ZealandNicaraguaNigerNigeriaNorth AmericaNorwayOECD membersOmanOther small statesPacific island small statesPakistanPalauPanamaPapua New GuineaParaguayPeruPhilippinesPolandPortugalPost-demographic dividendPre-demographic dividendPuerto RicoQatarRomaniaRussian FederationRwandaSamoaSan MarinoSao Tome and PrincipeSaudi ArabiaSenegalSerbiaSeychellesSierra LeoneSingaporeSlovak RepublicSloveniaSmall statesSolomon IslandsSomaliaSouth AfricaSouth AsiaSouth Asia (IDA & IBRD)South SudanSpainSri LankaSt. Kitts and NevisSt. LuciaSt. Vincent and the GrenadinesSub-Saharan Africa Sub-Saharan Africa (excluding high income)Sub-Saharan Africa (IDA & IBRD countries)SudanSurinameSwazilandSwedenSwitzerlandSyrian Arab RepublicTajikistanTanzaniaThailandTimor-LesteTogoTongaTrinidad and TobagoTunisiaTurkeyTurkmenistanTuvaluUgandaUkraineUnited Arab EmiratesUnited KingdomUnited StatesUpper middle incomeUruguayUzbekistanVanuatuVenezuela, RBVietnamVirgin Islands (U.S.)West Bank and GazaWorldYemen, Rep.ZambiaZimbabwe Timeline:
This timeline shows a graph from 1971 to 2015 of Middle East & North Africa (excluding high income). No data until 1970. Number of actual observations by date: 45.
Source name:
World Development Indicators
Source organization:
World Bank staff estimates based on sources and methods in World Bank's "The Changing Wealth of Nations: Measuring Sustainable Development in the New Millennium" (2011).
Categories, topics:
Economy & Growth, Energy & Mining, Environment
Last updated:
apr 23, 2017
Indicators value changes by year
At the date of observation
Value
Absolute change
Change from previous value
jan 1, 1971
0.055
+0.055
0.0%
jan 1, 1972
0.036
-0.019
-34.09%
jan 1, 1973
0.025
-0.011
-30.58%
jan 1, 1974
0.069
+0.045
178.45%
jan 1, 1975
0.615
+0.545
784.91%
jan 1, 1976
0.49
-0.125
-20.26%
jan 1, 1977
0.155
-0.335
-68.39%
jan 1, 1978
0.093
-0.062
-40.12%
jan 1, 1979
0.052
-0.041
-44.33%
jan 1, 1980
0.079
+0.028
53.72%
jan 1, 1981
0.098
+0.019
23.94%
jan 1, 1982
0.112
+0.014
14.11%
jan 1, 1983
0.073
-0.039
-34.83%
jan 1, 1984
0.049
-0.024
-32.93%
jan 1, 1985
0.058
+0.009
19.02%
jan 1, 1986
0.042
-0.017
-28.75%
jan 1, 1987
0.017
-0.024
-58.77%
jan 1, 1988
0.009
-0.008
-46.64%
jan 1, 1989
0.123
+0.114
1.25K%
jan 1, 1990
0.061
-0.062
-50.22%
jan 1, 1991
0.033
-0.028
-45.72%
jan 1, 1992
0.057
+0.024
70.81%
jan 1, 1993
0.047
-0.01
-17.55%
jan 1, 1994
0.018
-0.029
-61.08%
jan 1, 1995
0.033
+0.015
80.59%
jan 1, 1996
0.04
+0.006
19.68%
jan 1, 1997
0.023
-0.017
-42.92%
jan 1, 1998
0.038
+0.016
70.13%
jan 1, 1999
0.043
+0.004
10.85%
jan 1, 2000
0.039
-0.004
-9.25%
jan 1, 2001
0.046
+0.007
18.11%
jan 1, 2002
0.039
-0.007
-15.09%
jan 1, 2003
0.036
-0.003
-8.26%
jan 1, 2004
0.03
-0.006
-15.89%
jan 1, 2005
0.05
+0.02
67.4%
jan 1, 2006
0.097
+0.047
93.33%
jan 1, 2007
0.207
+0.11
113.62%
jan 1, 2008
0.302
+0.095
46.11%
jan 1, 2009
0.848
+0.546
180.85%
jan 1, 2010
0.266
-0.582
-68.64%
jan 1, 2011
0.371
+0.105
39.49%
jan 1, 2012
0.481
+0.11
29.66%
jan 1, 2013
0.422
-0.058
-12.14%
jan 1, 2014
0.361
-0.062
-14.65%
jan 1, 2015
0.185
-0.176
-48.68%
Ranking of countries by current statistics by years


Comments: