29
/
en
AIzaSyAYiBZKx7MnpbEhh9jyipgxe19OcubqV5w
April 1, 2024
66444
Algeria
DZA
true
2
1
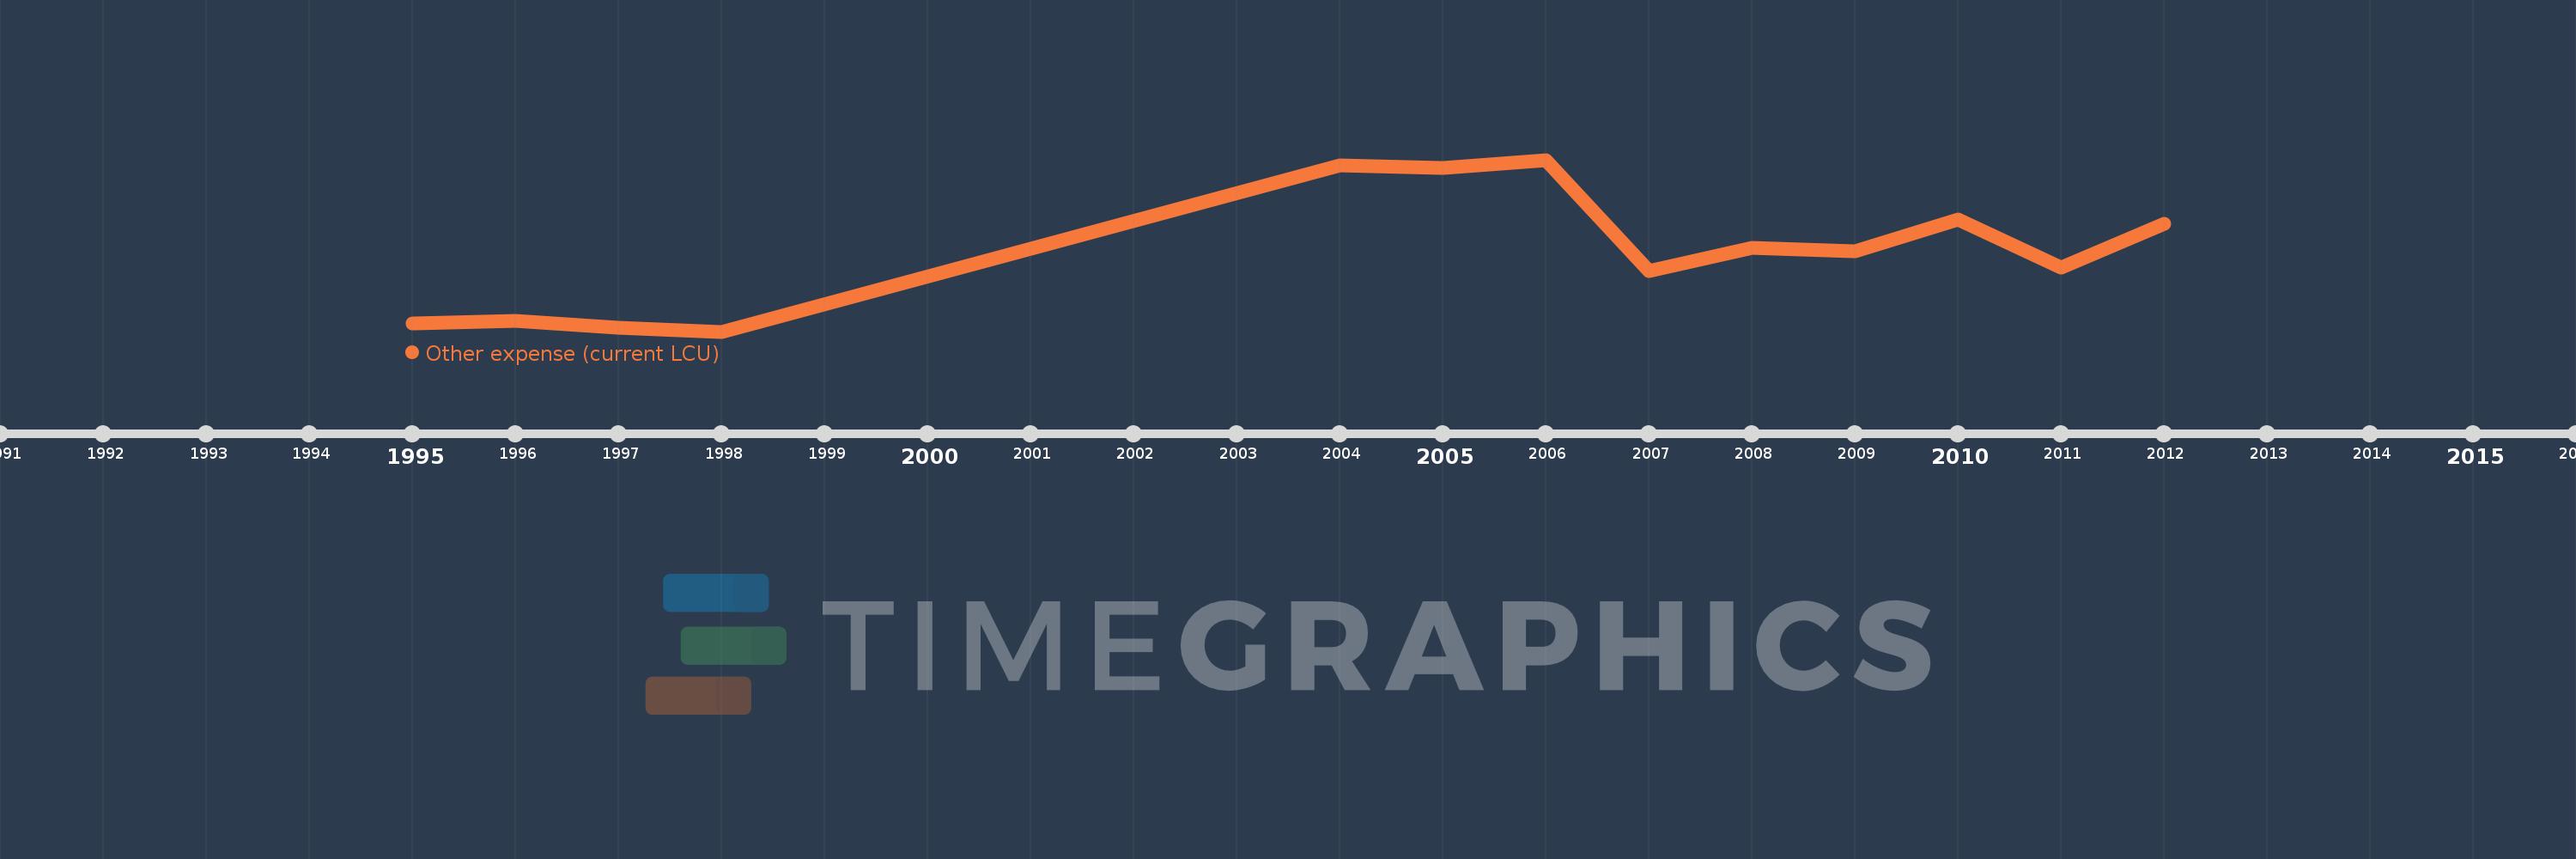
Other expense (current LCU)
2012,2011,2010,2009,2008,2007,2006,2005,2004,1998,1997,1996,1995
This statistics in other country:
AfghanistanAlbaniaAlgeriaAngolaArmeniaAustraliaAustriaAzerbaijanBahrainBangladeshBarbadosBelarusBelgiumBelizeBeninBhutanBoliviaBosnia and HerzegovinaBotswanaBrazilBulgariaBurkina FasoBurundiCabo VerdeCambodiaCanadaCentral African RepublicChileColombiaCongo, Dem. Rep.Congo, Rep.Costa RicaCote d'IvoireCroatiaCyprusCzech RepublicDenmarkDominican RepublicEgypt, Arab Rep.El SalvadorEquatorial GuineaEstoniaEthiopiaFijiFinlandFranceGambia, TheGeorgiaGermanyGhanaGreeceGrenadaGuatemalaHondurasHong Kong SAR, ChinaHungaryIcelandIndiaIndonesiaIran, Islamic Rep.IraqIrelandIsraelItalyJamaicaJapanJordanKazakhstanKenyaKiribatiKorea, Rep.KuwaitKyrgyz RepublicLao PDRLatviaLebanonLesothoLithuaniaLuxembourgMacao SAR, ChinaMacedonia, FYRMadagascarMalawiMalaysiaMaldivesMaliMaltaMauritiusMicronesia, Fed. Sts.MoldovaMongoliaMoroccoMozambiqueNamibiaNepalNetherlandsNew ZealandNicaraguaNorwayOmanPakistanPanamaPapua New GuineaParaguayPeruPhilippinesPolandPortugalQatarRomaniaRussian FederationRwandaSamoaSan MarinoSao Tome and PrincipeSerbiaSeychellesSierra LeoneSlovak RepublicSloveniaSolomon IslandsSouth AfricaSpainSri LankaSurinameSwazilandSwedenSwitzerlandTajikistanTanzaniaThailandTimor-LesteTogoTrinidad and TobagoTunisiaTurkeyUgandaUkraineUnited Arab EmiratesUnited KingdomUnited StatesUruguayVanuatuVenezuela, RBWest Bank and GazaYemen, Rep.Zambia Timeline:
This timeline shows a graph from 1995 to 2012 of Algeria. No data until 1994. Number of actual observations by date: 13.
Source name:
World Development Indicators
Source organization:
International Monetary Fund, Government Finance Statistics Yearbook and data files.
Categories, topics:
Public Sector
Last updated:
apr 23, 2017
Indicators value changes by year
Minimum:
18.0 bln
jan 1, 1998
Maximum:
316.416 bln
jan 1, 2006
At the date of observation
Value
Absolute change
Change from previous value
jan 1, 1995
31.731 bln
+31.731 bln
0.0%
jan 1, 1996
36.88 bln
+5.149 bln
16.23%
jan 1, 1997
24.4 bln
-12.48 bln
-33.84%
jan 1, 1998
18.0 bln
-6.4 bln
-26.23%
jan 1, 2004
306.166 bln
+288.166 bln
1.6K%
jan 1, 2005
302.032 bln
-4.134 bln
-1.35%
jan 1, 2006
316.416 bln
+14.384 bln
4.76%
jan 1, 2007
122.56 bln
-193.856 bln
-61.27%
jan 1, 2008
163.44 bln
+40.88 bln
33.36%
jan 1, 2009
157.78 bln
-5.66 bln
-3.46%
jan 1, 2010
212.209 bln
+54.429 bln
34.5%
jan 1, 2011
128.9 bln
-83.309 bln
-39.26%
jan 1, 2012
205.658 bln
+76.758 bln
59.55%
Ranking of countries by current statistics by years


Comments: