29
/
en
AIzaSyAYiBZKx7MnpbEhh9jyipgxe19OcubqV5w
April 1, 2024
185630
Madagascar
MDG
true
2
1
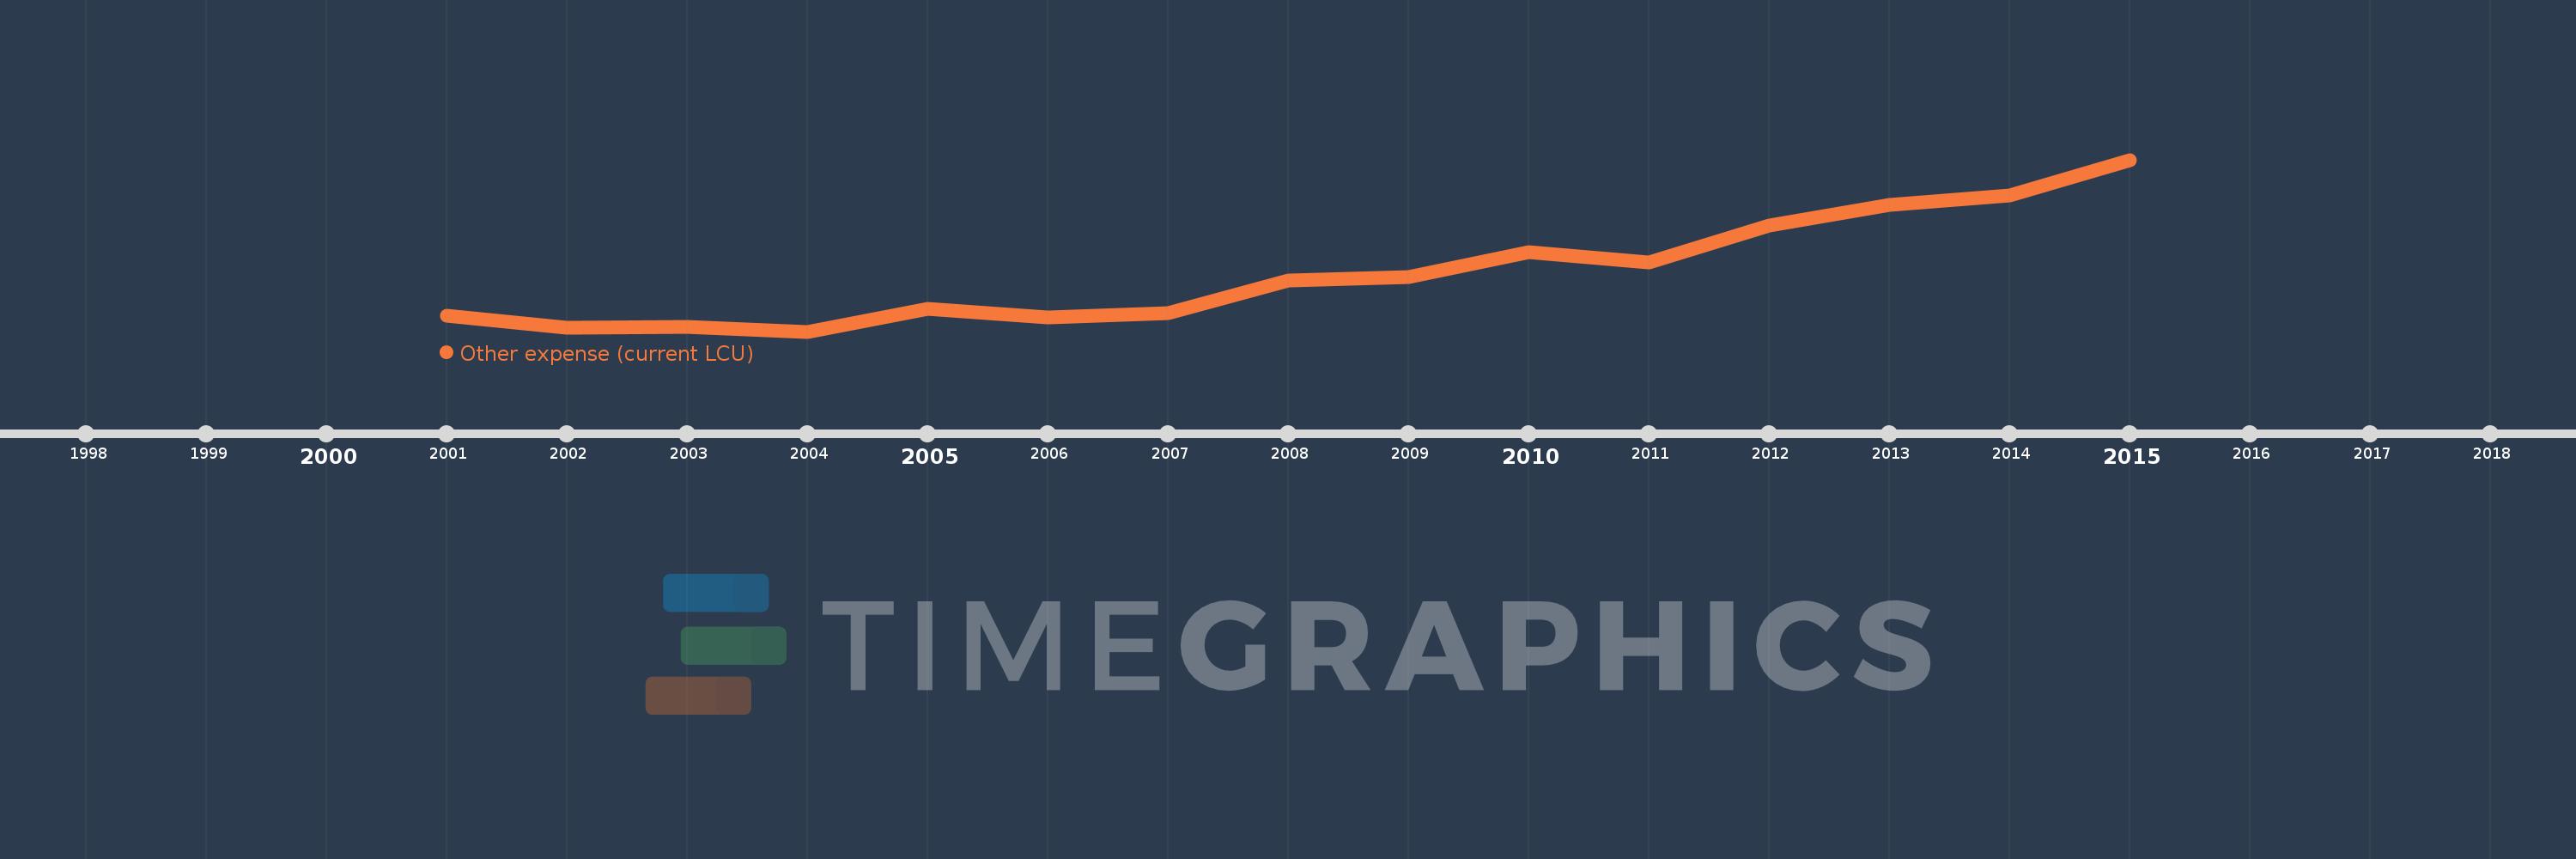
Other expense (current LCU)
2015,2014,2013,2012,2011,2010,2009,2008,2007,2006,2005,2004,2003,2002,2001
This statistics in other country:
AfghanistanAlbaniaAlgeriaAngolaArmeniaAustraliaAustriaAzerbaijanBahrainBangladeshBarbadosBelarusBelgiumBelizeBeninBhutanBoliviaBosnia and HerzegovinaBotswanaBrazilBulgariaBurkina FasoBurundiCabo VerdeCambodiaCanadaCentral African RepublicChileColombiaCongo, Dem. Rep.Congo, Rep.Costa RicaCote d'IvoireCroatiaCyprusCzech RepublicDenmarkDominican RepublicEgypt, Arab Rep.El SalvadorEquatorial GuineaEstoniaEthiopiaFijiFinlandFranceGambia, TheGeorgiaGermanyGhanaGreeceGrenadaGuatemalaHondurasHong Kong SAR, ChinaHungaryIcelandIndiaIndonesiaIran, Islamic Rep.IraqIrelandIsraelItalyJamaicaJapanJordanKazakhstanKenyaKiribatiKorea, Rep.KuwaitKyrgyz RepublicLao PDRLatviaLebanonLesothoLithuaniaLuxembourgMacao SAR, ChinaMacedonia, FYRMadagascarMalawiMalaysiaMaldivesMaliMaltaMauritiusMicronesia, Fed. Sts.MoldovaMongoliaMoroccoMozambiqueNamibiaNepalNetherlandsNew ZealandNicaraguaNorwayOmanPakistanPanamaPapua New GuineaParaguayPeruPhilippinesPolandPortugalQatarRomaniaRussian FederationRwandaSamoaSan MarinoSao Tome and PrincipeSerbiaSeychellesSierra LeoneSlovak RepublicSloveniaSolomon IslandsSouth AfricaSpainSri LankaSurinameSwazilandSwedenSwitzerlandTajikistanTanzaniaThailandTimor-LesteTogoTrinidad and TobagoTunisiaTurkeyUgandaUkraineUnited Arab EmiratesUnited KingdomUnited StatesUruguayVanuatuVenezuela, RBWest Bank and GazaYemen, Rep.Zambia Timeline:
This timeline shows a graph from 2001 to 2015 of Madagascar. No data until 2000. Number of actual observations by date: 15.
Source name:
World Development Indicators
Source organization:
International Monetary Fund, Government Finance Statistics Yearbook and data files.
Categories, topics:
Public Sector
Last updated:
apr 23, 2017
Indicators value changes by year
Minimum:
38.94 bln
jan 1, 2004
Maximum:
732.787 bln
jan 1, 2015
At the date of observation
Value
Absolute change
Change from previous value
jan 1, 2001
103.46 bln
+103.46 bln
0.0%
jan 1, 2002
53.52 bln
-49.94 bln
-48.27%
jan 1, 2003
58.68 bln
+5.16 bln
9.64%
jan 1, 2004
38.94 bln
-19.74 bln
-33.64%
jan 1, 2005
130.68 bln
+91.74 bln
235.59%
jan 1, 2006
96.1 bln
-34.58 bln
-26.46%
jan 1, 2007
114.6 bln
+18.5 bln
19.25%
jan 1, 2008
246.794 bln
+132.194 bln
115.35%
jan 1, 2009
259.3 bln
+12.506 bln
5.07%
jan 1, 2010
360.079 bln
+100.779 bln
38.87%
jan 1, 2011
316.679 bln
-43.4 bln
-12.05%
jan 1, 2012
467.978 bln
+151.299 bln
47.78%
jan 1, 2013
550.981 bln
+83.003 bln
17.74%
jan 1, 2014
590.0 bln
+39.019 bln
7.08%
jan 1, 2015
732.787 bln
+142.787 bln
24.2%
Ranking of countries by current statistics by years


Comments: