29
/
en
AIzaSyAYiBZKx7MnpbEhh9jyipgxe19OcubqV5w
April 1, 2024
118276
Czech Republic
CZE
true
2
1
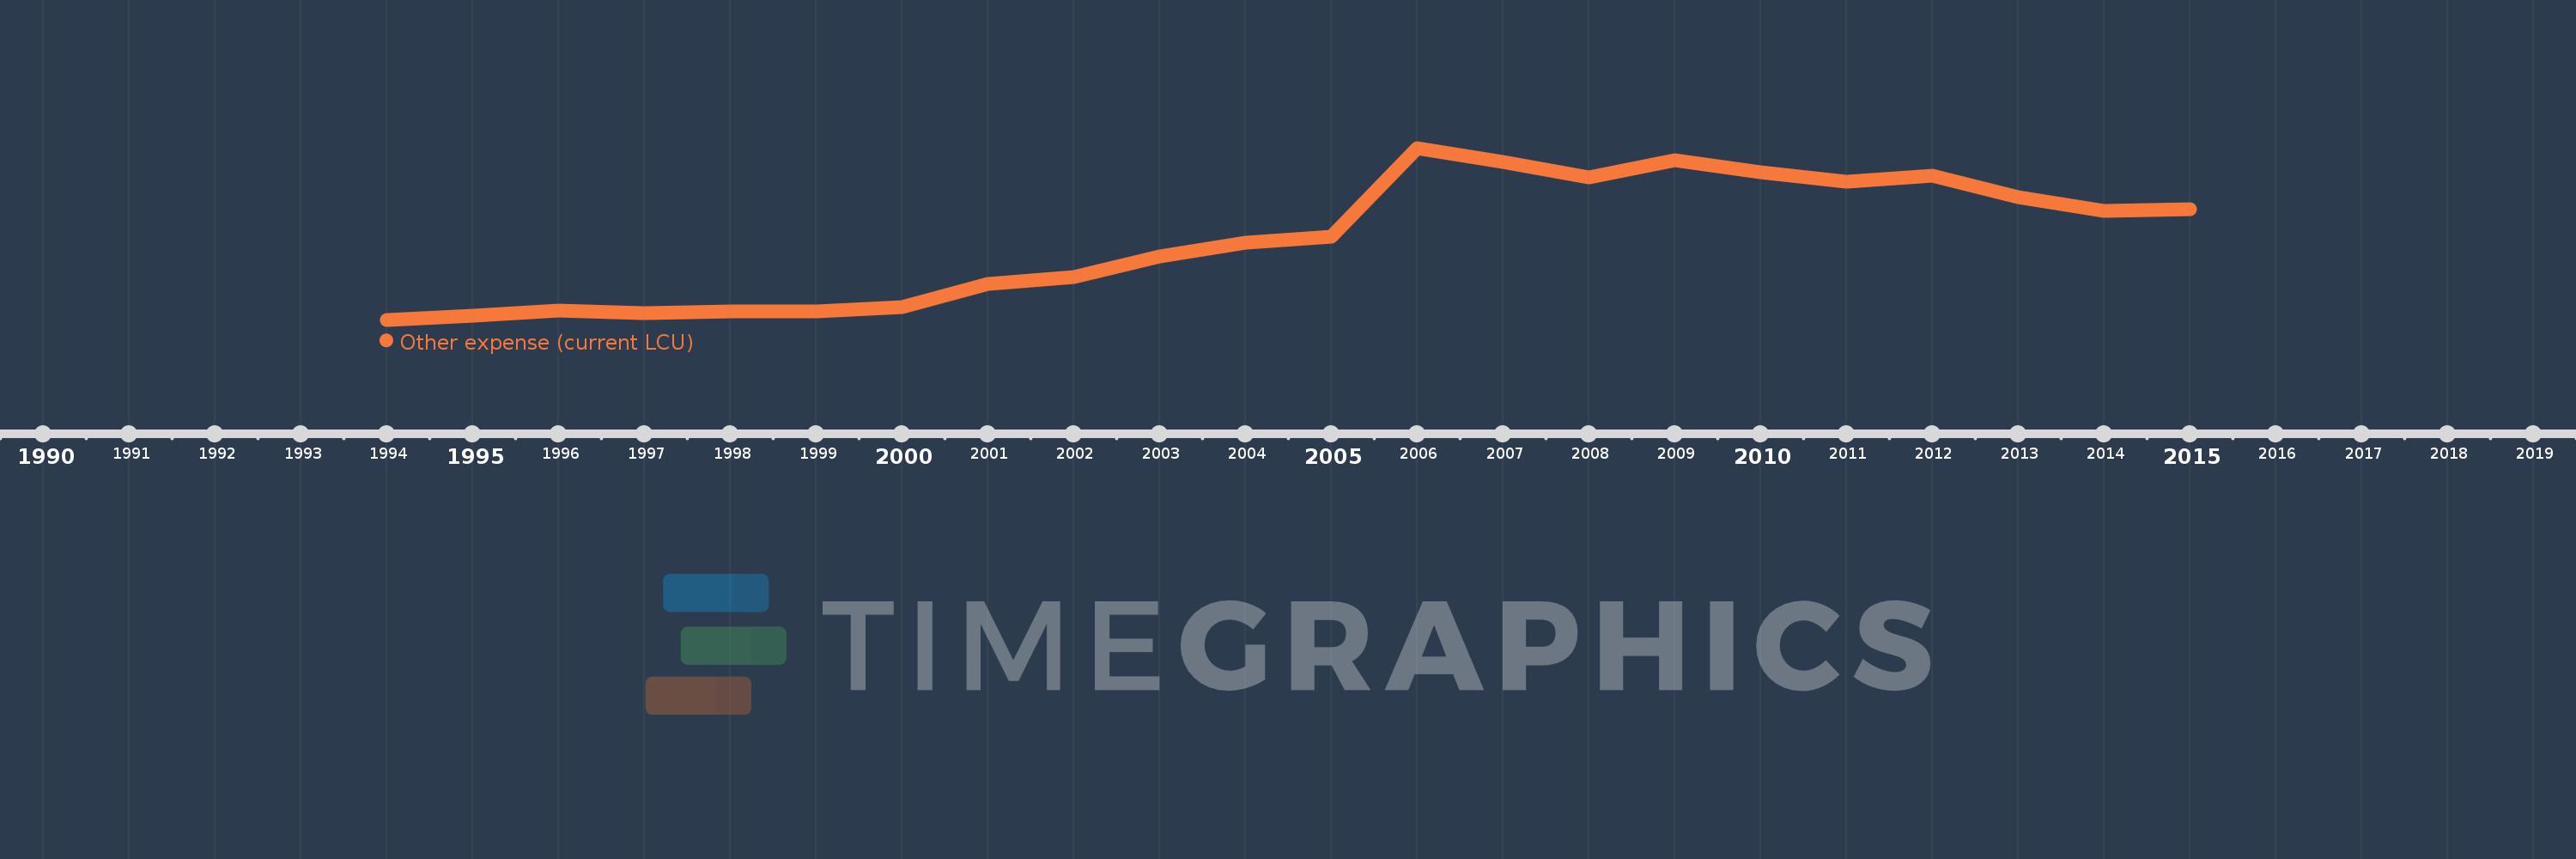
Other expense (current LCU)
2015,2014,2013,2012,2011,2010,2009,2008,2007,2006,2005,2004,2003,2002,2001,2000,1999,1998,1997,1996,1995,1994
This statistics in other country:
AfghanistanAlbaniaAlgeriaAngolaArmeniaAustraliaAustriaAzerbaijanBahrainBangladeshBarbadosBelarusBelgiumBelizeBeninBhutanBoliviaBosnia and HerzegovinaBotswanaBrazilBulgariaBurkina FasoBurundiCabo VerdeCambodiaCanadaCentral African RepublicChileColombiaCongo, Dem. Rep.Congo, Rep.Costa RicaCote d'IvoireCroatiaCyprusCzech RepublicDenmarkDominican RepublicEgypt, Arab Rep.El SalvadorEquatorial GuineaEstoniaEthiopiaFijiFinlandFranceGambia, TheGeorgiaGermanyGhanaGreeceGrenadaGuatemalaHondurasHong Kong SAR, ChinaHungaryIcelandIndiaIndonesiaIran, Islamic Rep.IraqIrelandIsraelItalyJamaicaJapanJordanKazakhstanKenyaKiribatiKorea, Rep.KuwaitKyrgyz RepublicLao PDRLatviaLebanonLesothoLithuaniaLuxembourgMacao SAR, ChinaMacedonia, FYRMadagascarMalawiMalaysiaMaldivesMaliMaltaMauritiusMicronesia, Fed. Sts.MoldovaMongoliaMoroccoMozambiqueNamibiaNepalNetherlandsNew ZealandNicaraguaNorwayOmanPakistanPanamaPapua New GuineaParaguayPeruPhilippinesPolandPortugalQatarRomaniaRussian FederationRwandaSamoaSan MarinoSao Tome and PrincipeSerbiaSeychellesSierra LeoneSlovak RepublicSloveniaSolomon IslandsSouth AfricaSpainSri LankaSurinameSwazilandSwedenSwitzerlandTajikistanTanzaniaThailandTimor-LesteTogoTrinidad and TobagoTunisiaTurkeyUgandaUkraineUnited Arab EmiratesUnited KingdomUnited StatesUruguayVanuatuVenezuela, RBWest Bank and GazaYemen, Rep.Zambia Timeline:
This timeline shows a graph from 1994 to 2015 of Czech Republic. No data until 1993. Number of actual observations by date: 22.
Source name:
World Development Indicators
Source organization:
International Monetary Fund, Government Finance Statistics Yearbook and data files.
Categories, topics:
Public Sector
Last updated:
apr 23, 2017
Indicators value changes by year
Minimum:
17.416 bln
jan 1, 1994
Maximum:
164.575 bln
jan 1, 2006
At the date of observation
Value
Absolute change
Change from previous value
jan 1, 1994
17.416 bln
+17.416 bln
0.0%
jan 1, 1995
20.678 bln
+3.262 bln
18.73%
jan 1, 1996
25.367 bln
+4.689 bln
22.68%
jan 1, 1997
23.01 bln
-2.357 bln
-9.29%
jan 1, 1998
24.433 bln
+1.423 bln
6.18%
jan 1, 1999
24.766 bln
+333.0 mln
1.36%
jan 1, 2000
27.996 bln
+3.23 bln
13.04%
jan 1, 2001
48.077 bln
+20.081 bln
71.73%
jan 1, 2002
53.628 bln
+5.551 bln
11.55%
jan 1, 2003
71.666 bln
+18.038 bln
33.64%
jan 1, 2004
83.177 bln
+11.511 bln
16.06%
jan 1, 2005
88.929 bln
+5.752 bln
6.92%
jan 1, 2006
164.575 bln
+75.646 bln
85.06%
jan 1, 2007
152.357 bln
-12.218 bln
-7.42%
jan 1, 2008
139.08 bln
-13.277 bln
-8.71%
jan 1, 2009
153.71 bln
+14.63 bln
10.52%
jan 1, 2010
143.631 bln
-10.079 bln
-6.56%
jan 1, 2011
135.592 bln
-8.039 bln
-5.6%
jan 1, 2012
140.694 bln
+5.102 bln
3.76%
jan 1, 2013
122.461 bln
-18.233 bln
-12.96%
jan 1, 2014
110.544 bln
-11.917 bln
-9.73%
jan 1, 2015
112.424 bln
+1.88 bln
1.7%
Ranking of countries by current statistics by years


Comments: