29
/
en
AIzaSyAYiBZKx7MnpbEhh9jyipgxe19OcubqV5w
April 1, 2024
111367
Congo, Rep.
COG
true
2
1
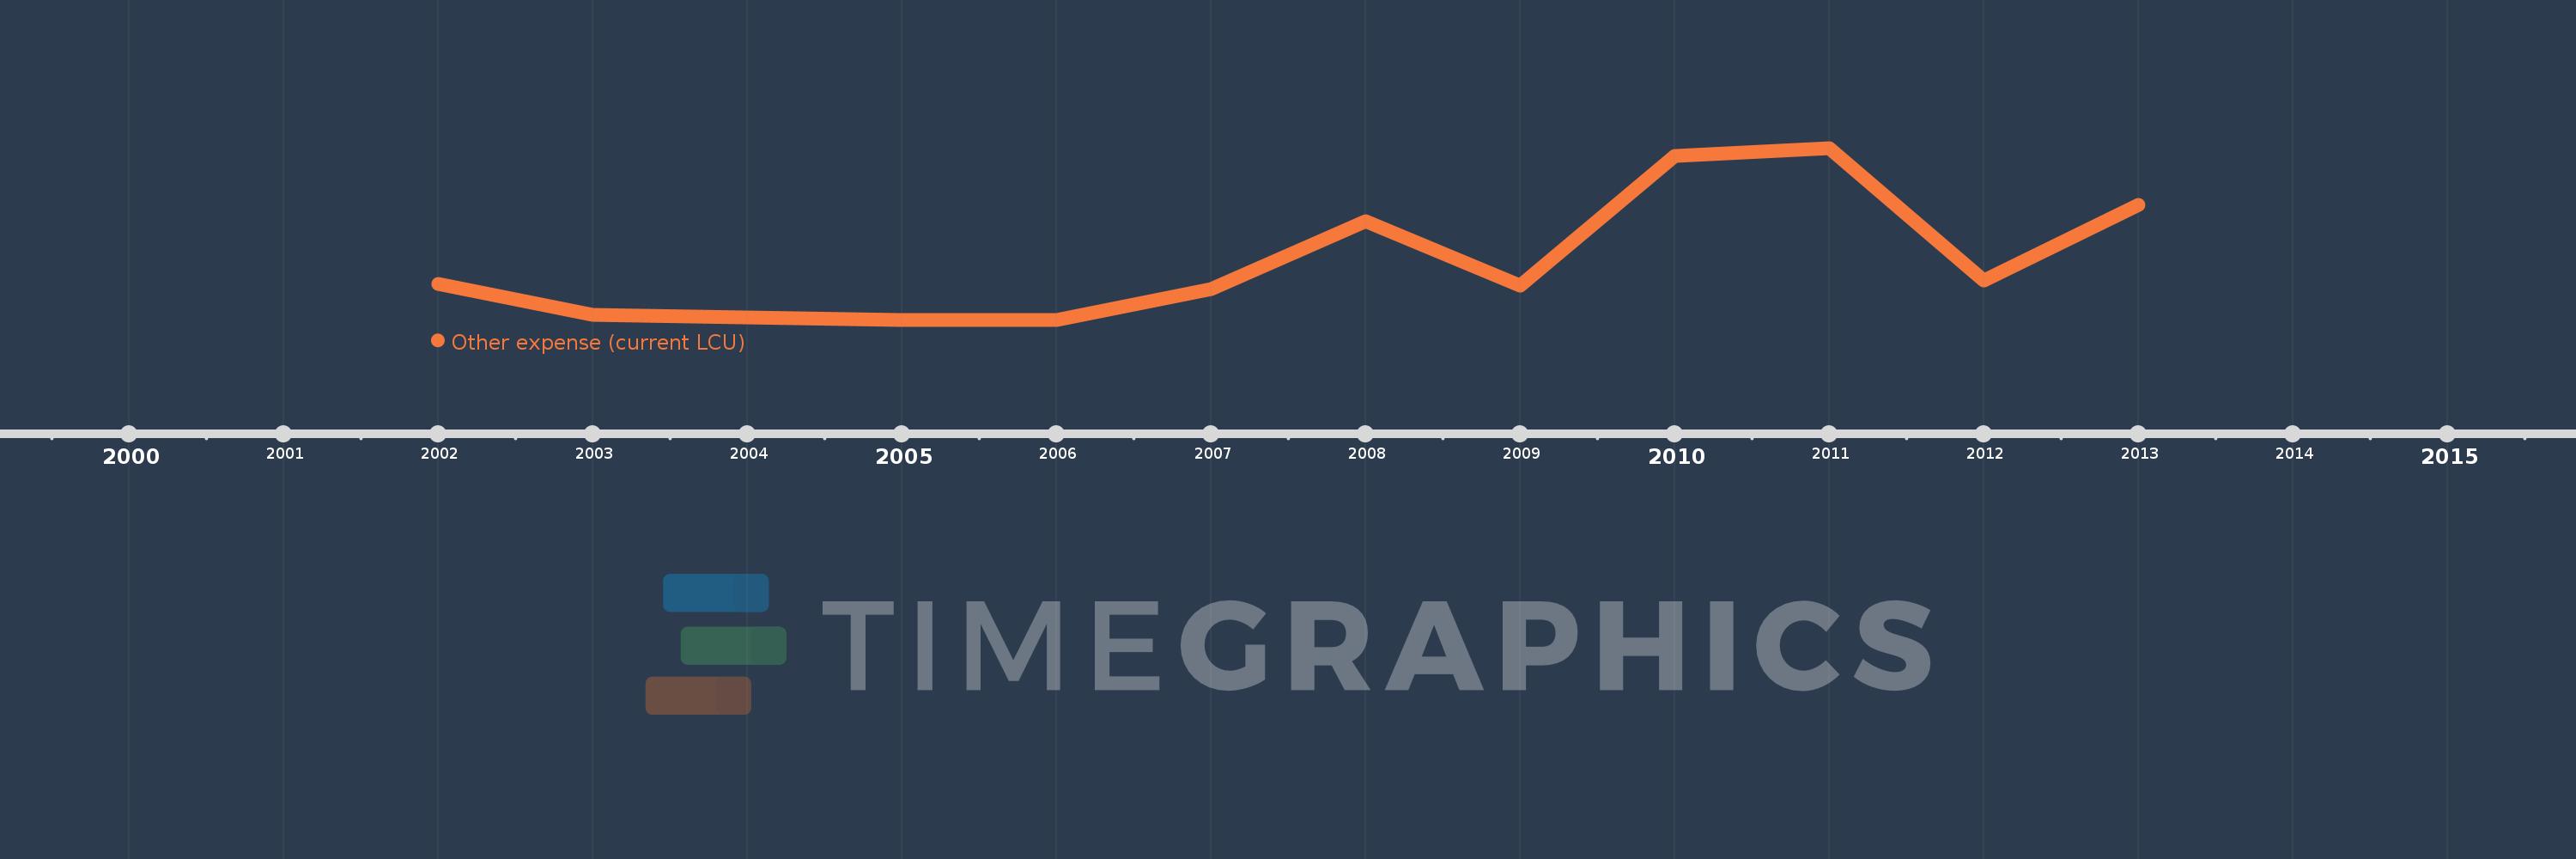
Other expense (current LCU)
2013,2012,2011,2010,2009,2008,2007,2006,2005,2004,2003,2002
This statistics in other country:
AfghanistanAlbaniaAlgeriaAngolaArmeniaAustraliaAustriaAzerbaijanBahrainBangladeshBarbadosBelarusBelgiumBelizeBeninBhutanBoliviaBosnia and HerzegovinaBotswanaBrazilBulgariaBurkina FasoBurundiCabo VerdeCambodiaCanadaCentral African RepublicChileColombiaCongo, Dem. Rep.Congo, Rep.Costa RicaCote d'IvoireCroatiaCyprusCzech RepublicDenmarkDominican RepublicEgypt, Arab Rep.El SalvadorEquatorial GuineaEstoniaEthiopiaFijiFinlandFranceGambia, TheGeorgiaGermanyGhanaGreeceGrenadaGuatemalaHondurasHong Kong SAR, ChinaHungaryIcelandIndiaIndonesiaIran, Islamic Rep.IraqIrelandIsraelItalyJamaicaJapanJordanKazakhstanKenyaKiribatiKorea, Rep.KuwaitKyrgyz RepublicLao PDRLatviaLebanonLesothoLithuaniaLuxembourgMacao SAR, ChinaMacedonia, FYRMadagascarMalawiMalaysiaMaldivesMaliMaltaMauritiusMicronesia, Fed. Sts.MoldovaMongoliaMoroccoMozambiqueNamibiaNepalNetherlandsNew ZealandNicaraguaNorwayOmanPakistanPanamaPapua New GuineaParaguayPeruPhilippinesPolandPortugalQatarRomaniaRussian FederationRwandaSamoaSan MarinoSao Tome and PrincipeSerbiaSeychellesSierra LeoneSlovak RepublicSloveniaSolomon IslandsSouth AfricaSpainSri LankaSurinameSwazilandSwedenSwitzerlandTajikistanTanzaniaThailandTimor-LesteTogoTrinidad and TobagoTunisiaTurkeyUgandaUkraineUnited Arab EmiratesUnited KingdomUnited StatesUruguayVanuatuVenezuela, RBWest Bank and GazaYemen, Rep.Zambia Timeline:
This timeline shows a graph from 2002 to 2013 of Congo, Rep.. No data until 2001. Number of actual observations by date: 12.
Source name:
World Development Indicators
Source organization:
International Monetary Fund, Government Finance Statistics Yearbook and data files.
Categories, topics:
Public Sector
Last updated:
apr 23, 2017
Indicators value changes by year
Minimum:
256.229 mln
jan 1, 2005
Maximum:
93.189 bln
jan 1, 2011
At the date of observation
Value
Absolute change
Change from previous value
jan 1, 2002
19.615 bln
+19.615 bln
0.0%
jan 1, 2003
2.749 bln
-16.865 bln
-85.98%
jan 1, 2004
1.55 bln
-1.199 bln
-43.63%
jan 1, 2005
256.229 mln
-1.294 bln
-83.47%
jan 1, 2006
332.494 mln
+76.264 mln
29.76%
jan 1, 2007
17.0 bln
+16.668 bln
5.01K%
jan 1, 2008
53.529 bln
+36.529 bln
214.88%
jan 1, 2009
18.766 bln
-34.763 bln
-64.94%
jan 1, 2010
88.967 bln
+70.201 bln
374.09%
jan 1, 2011
93.189 bln
+4.221 bln
4.74%
jan 1, 2012
21.285 bln
-71.904 bln
-77.16%
jan 1, 2013
62.38 bln
+41.095 bln
193.07%
Ranking of countries by current statistics by years


Comments: