29
/
en
AIzaSyAYiBZKx7MnpbEhh9jyipgxe19OcubqV5w
April 1, 2024
267235
Trinidad and Tobago
TTO
true
2
1
Other expense (current LCU)
2013,2011,2010,2009,2008,2007,2006,2005,2004,2003,2002,1994
This statistics in other country:
AfghanistanAlbaniaAlgeriaAngolaArmeniaAustraliaAustriaAzerbaijanBahrainBangladeshBarbadosBelarusBelgiumBelizeBeninBhutanBoliviaBosnia and HerzegovinaBotswanaBrazilBulgariaBurkina FasoBurundiCabo VerdeCambodiaCanadaCentral African RepublicChileColombiaCongo, Dem. Rep.Congo, Rep.Costa RicaCote d'IvoireCroatiaCyprusCzech RepublicDenmarkDominican RepublicEgypt, Arab Rep.El SalvadorEquatorial GuineaEstoniaEthiopiaFijiFinlandFranceGambia, TheGeorgiaGermanyGhanaGreeceGrenadaGuatemalaHondurasHong Kong SAR, ChinaHungaryIcelandIndiaIndonesiaIran, Islamic Rep.IraqIrelandIsraelItalyJamaicaJapanJordanKazakhstanKenyaKiribatiKorea, Rep.KuwaitKyrgyz RepublicLao PDRLatviaLebanonLesothoLithuaniaLuxembourgMacao SAR, ChinaMacedonia, FYRMadagascarMalawiMalaysiaMaldivesMaliMaltaMauritiusMicronesia, Fed. Sts.MoldovaMongoliaMoroccoMozambiqueNamibiaNepalNetherlandsNew ZealandNicaraguaNorwayOmanPakistanPanamaPapua New GuineaParaguayPeruPhilippinesPolandPortugalQatarRomaniaRussian FederationRwandaSamoaSan MarinoSao Tome and PrincipeSerbiaSeychellesSierra LeoneSlovak RepublicSloveniaSolomon IslandsSouth AfricaSpainSri LankaSurinameSwazilandSwedenSwitzerlandTajikistanTanzaniaThailandTimor-LesteTogoTrinidad and TobagoTunisiaTurkeyUgandaUkraineUnited Arab EmiratesUnited KingdomUnited StatesUruguayVanuatuVenezuela, RBWest Bank and GazaYemen, Rep.Zambia Timeline:
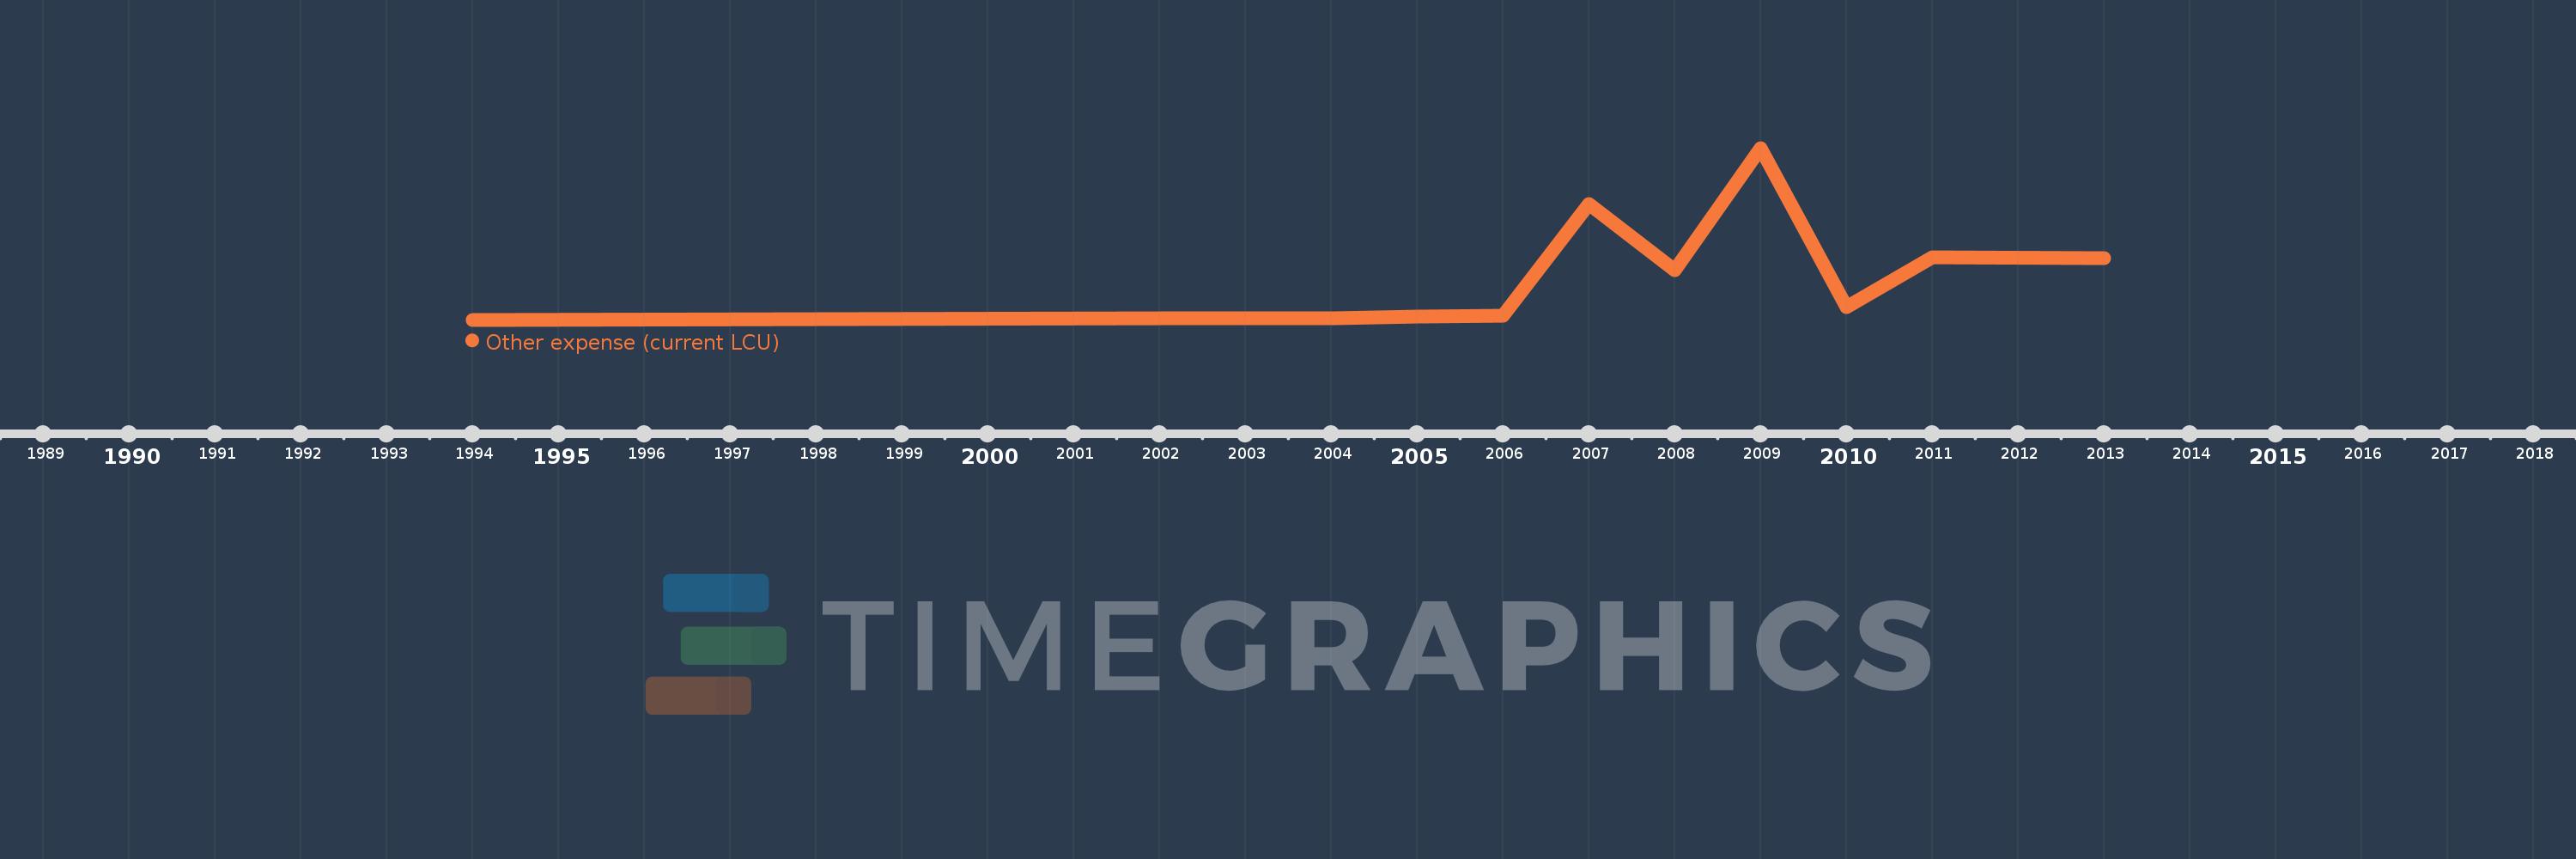
This timeline shows a graph from 1994 to 2013 of Trinidad and Tobago. No data until 1993. Number of actual observations by date: 12.
Source name:
World Development Indicators
Source organization:
International Monetary Fund, Government Finance Statistics Yearbook and data files.
Categories, topics:
Public Sector
Last updated:
apr 23, 2017
Indicators value changes by year
Minimum:
95.4 mln
jan 1, 1994
Maximum:
9.659 bln
jan 1, 2009
At the date of observation
Value
Absolute change
Change from previous value
jan 1, 1994
95.4 mln
+95.4 mln
0.0%
jan 1, 2002
171.3 mln
+75.9 mln
79.56%
jan 1, 2003
169.9 mln
-1.4 mln
-0.82%
jan 1, 2004
193.3 mln
+23.4 mln
13.77%
jan 1, 2005
271.2 mln
+77.9 mln
40.3%
jan 1, 2006
314.1 mln
+42.9 mln
15.82%
jan 1, 2007
6.528 bln
+6.213 bln
1.98K%
jan 1, 2008
2.833 bln
-3.695 bln
-56.61%
jan 1, 2009
9.659 bln
+6.826 bln
240.99%
jan 1, 2010
805.6 mln
-8.853 bln
-91.66%
jan 1, 2011
3.586 bln
+2.781 bln
345.16%
jan 1, 2013
3.517 bln
-68.9 mln
-1.92%
Ranking of countries by current statistics by years


Comments: