29
/
en
AIzaSyAYiBZKx7MnpbEhh9jyipgxe19OcubqV5w
April 1, 2024
95290
Burkina Faso
BFA
true
2
1
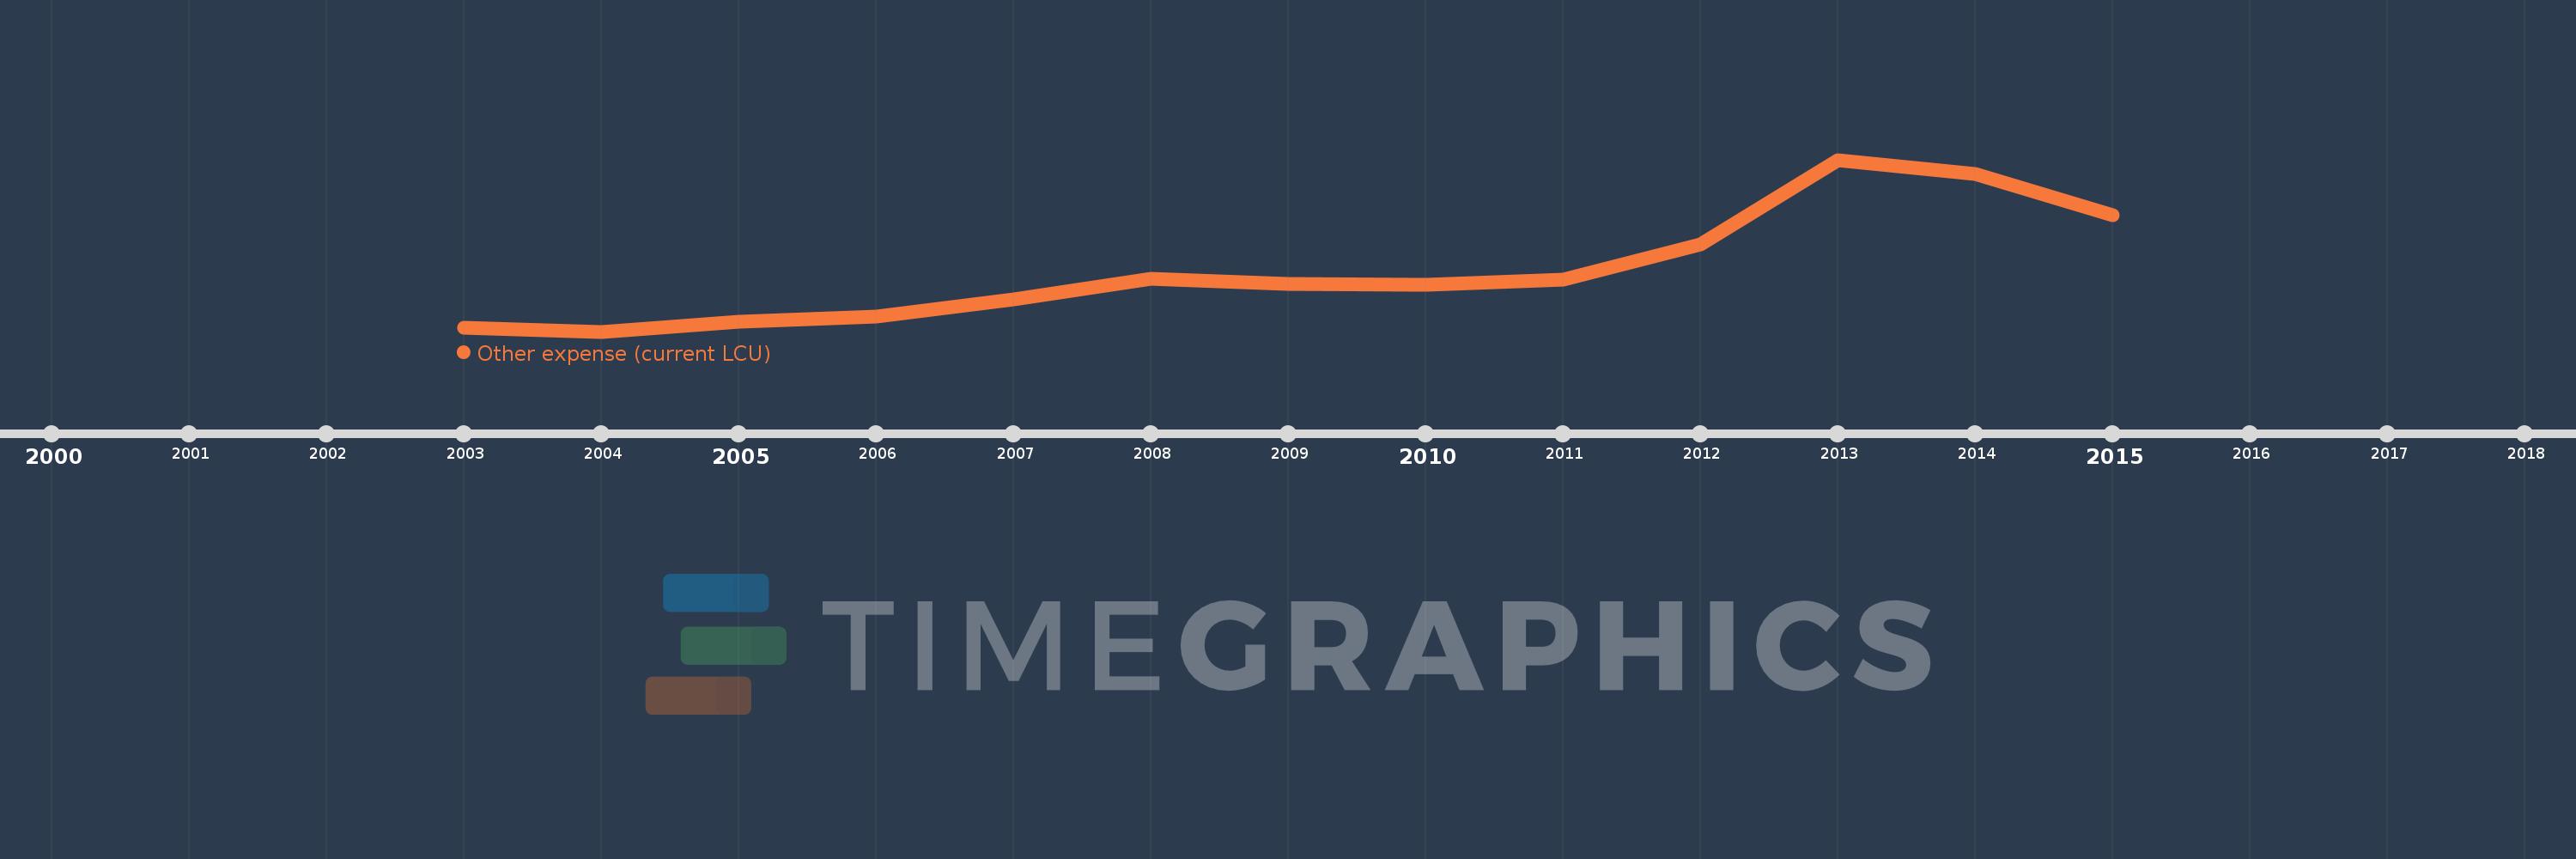
Other expense (current LCU)
2015,2014,2013,2012,2011,2010,2009,2008,2007,2006,2005,2004,2003
This statistics in other country:
AfghanistanAlbaniaAlgeriaAngolaArmeniaAustraliaAustriaAzerbaijanBahrainBangladeshBarbadosBelarusBelgiumBelizeBeninBhutanBoliviaBosnia and HerzegovinaBotswanaBrazilBulgariaBurkina FasoBurundiCabo VerdeCambodiaCanadaCentral African RepublicChileColombiaCongo, Dem. Rep.Congo, Rep.Costa RicaCote d'IvoireCroatiaCyprusCzech RepublicDenmarkDominican RepublicEgypt, Arab Rep.El SalvadorEquatorial GuineaEstoniaEthiopiaFijiFinlandFranceGambia, TheGeorgiaGermanyGhanaGreeceGrenadaGuatemalaHondurasHong Kong SAR, ChinaHungaryIcelandIndiaIndonesiaIran, Islamic Rep.IraqIrelandIsraelItalyJamaicaJapanJordanKazakhstanKenyaKiribatiKorea, Rep.KuwaitKyrgyz RepublicLao PDRLatviaLebanonLesothoLithuaniaLuxembourgMacao SAR, ChinaMacedonia, FYRMadagascarMalawiMalaysiaMaldivesMaliMaltaMauritiusMicronesia, Fed. Sts.MoldovaMongoliaMoroccoMozambiqueNamibiaNepalNetherlandsNew ZealandNicaraguaNorwayOmanPakistanPanamaPapua New GuineaParaguayPeruPhilippinesPolandPortugalQatarRomaniaRussian FederationRwandaSamoaSan MarinoSao Tome and PrincipeSerbiaSeychellesSierra LeoneSlovak RepublicSloveniaSolomon IslandsSouth AfricaSpainSri LankaSurinameSwazilandSwedenSwitzerlandTajikistanTanzaniaThailandTimor-LesteTogoTrinidad and TobagoTunisiaTurkeyUgandaUkraineUnited Arab EmiratesUnited KingdomUnited StatesUruguayVanuatuVenezuela, RBWest Bank and GazaYemen, Rep.Zambia Timeline:
This timeline shows a graph from 2003 to 2015 of Burkina Faso. No data until 2002. Number of actual observations by date: 13.
Source name:
World Development Indicators
Source organization:
International Monetary Fund, Government Finance Statistics Yearbook and data files.
Categories, topics:
Public Sector
Last updated:
apr 23, 2017
Indicators value changes by year
Minimum:
43.816 bln
jan 1, 2004
Maximum:
259.625 bln
jan 1, 2013
At the date of observation
Value
Absolute change
Change from previous value
jan 1, 2003
48.282 bln
+48.282 bln
0.0%
jan 1, 2004
43.816 bln
-4.466 bln
-9.25%
jan 1, 2005
55.881 bln
+12.066 bln
27.54%
jan 1, 2006
63.043 bln
+7.161 bln
12.82%
jan 1, 2007
83.767 bln
+20.724 bln
32.87%
jan 1, 2008
110.383 bln
+26.616 bln
31.77%
jan 1, 2009
103.374 bln
-7.01 bln
-6.35%
jan 1, 2010
103.134 bln
-239.915 mln
-0.23%
jan 1, 2011
109.285 bln
+6.151 bln
5.96%
jan 1, 2012
153.036 bln
+43.751 bln
40.03%
jan 1, 2013
259.625 bln
+106.589 bln
69.65%
jan 1, 2014
241.762 bln
-17.863 bln
-6.88%
jan 1, 2015
189.855 bln
-51.907 bln
-21.47%
Ranking of countries by current statistics by years


Comments: