29
/
en
AIzaSyAYiBZKx7MnpbEhh9jyipgxe19OcubqV5w
April 1, 2024
129729
Estonia
EST
true
2
1
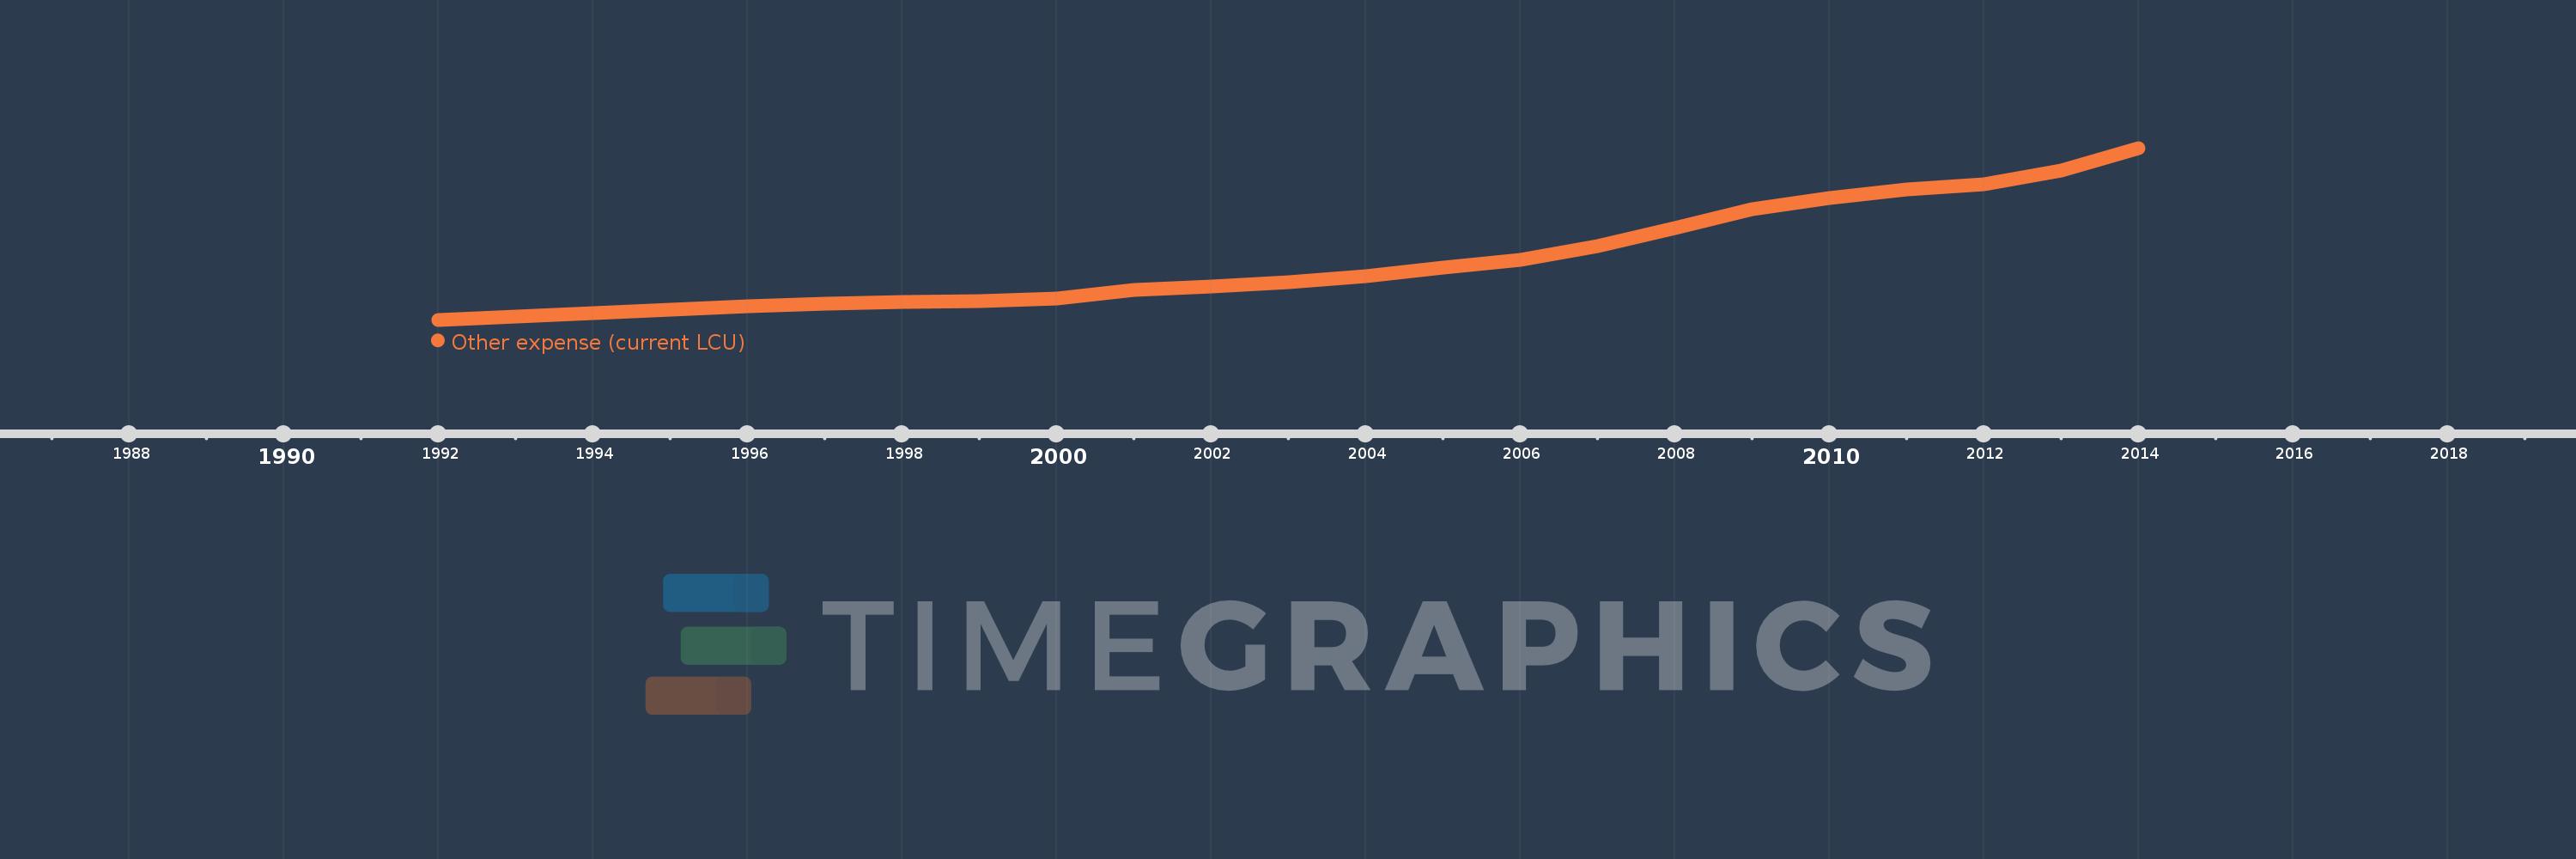
Other expense (current LCU)
2014,2013,2012,2011,2010,2009,2008,2007,2006,2005,2004,2003,2002,2001,2000,1999,1998,1997,1996,1992
This statistics in other country:
AfghanistanAlbaniaAlgeriaAngolaArmeniaAustraliaAustriaAzerbaijanBahrainBangladeshBarbadosBelarusBelgiumBelizeBeninBhutanBoliviaBosnia and HerzegovinaBotswanaBrazilBulgariaBurkina FasoBurundiCabo VerdeCambodiaCanadaCentral African RepublicChileColombiaCongo, Dem. Rep.Congo, Rep.Costa RicaCote d'IvoireCroatiaCyprusCzech RepublicDenmarkDominican RepublicEgypt, Arab Rep.El SalvadorEquatorial GuineaEstoniaEthiopiaFijiFinlandFranceGambia, TheGeorgiaGermanyGhanaGreeceGrenadaGuatemalaHondurasHong Kong SAR, ChinaHungaryIcelandIndiaIndonesiaIran, Islamic Rep.IraqIrelandIsraelItalyJamaicaJapanJordanKazakhstanKenyaKiribatiKorea, Rep.KuwaitKyrgyz RepublicLao PDRLatviaLebanonLesothoLithuaniaLuxembourgMacao SAR, ChinaMacedonia, FYRMadagascarMalawiMalaysiaMaldivesMaliMaltaMauritiusMicronesia, Fed. Sts.MoldovaMongoliaMoroccoMozambiqueNamibiaNepalNetherlandsNew ZealandNicaraguaNorwayOmanPakistanPanamaPapua New GuineaParaguayPeruPhilippinesPolandPortugalQatarRomaniaRussian FederationRwandaSamoaSan MarinoSao Tome and PrincipeSerbiaSeychellesSierra LeoneSlovak RepublicSloveniaSolomon IslandsSouth AfricaSpainSri LankaSurinameSwazilandSwedenSwitzerlandTajikistanTanzaniaThailandTimor-LesteTogoTrinidad and TobagoTunisiaTurkeyUgandaUkraineUnited Arab EmiratesUnited KingdomUnited StatesUruguayVanuatuVenezuela, RBWest Bank and GazaYemen, Rep.Zambia Timeline:
This timeline shows a graph from 1992 to 2014 of Estonia. No data until 1991. Number of actual observations by date: 20.
Source name:
World Development Indicators
Source organization:
International Monetary Fund, Government Finance Statistics Yearbook and data files.
Categories, topics:
Public Sector
Last updated:
apr 23, 2017
Indicators value changes by year
Minimum:
40.03K
jan 1, 1992
Maximum:
27.591 mln
jan 1, 2014
At the date of observation
Value
Absolute change
Change from previous value
jan 1, 1992
40.03K
+40.03K
0.0%
jan 1, 1996
2.256 mln
+2.216 mln
5.54K%
jan 1, 1997
2.652 mln
+396.252K
17.56%
jan 1, 1998
2.876 mln
+223.691K
8.43%
jan 1, 1999
3.01 mln
+134.214K
4.67%
jan 1, 2000
3.387 mln
+377.079K
12.53%
jan 1, 2001
4.781 mln
+1.393 mln
41.13%
jan 1, 2002
5.33 mln
+549.64K
11.5%
jan 1, 2003
6.091 mln
+760.549K
14.27%
jan 1, 2004
7.005 mln
+913.937K
15.01%
jan 1, 2005
8.443 mln
+1.438 mln
20.53%
jan 1, 2006
9.676 mln
+1.233 mln
14.61%
jan 1, 2007
11.811 mln
+2.135 mln
22.06%
jan 1, 2008
14.757 mln
+2.946 mln
24.95%
jan 1, 2009
17.806 mln
+3.049 mln
20.66%
jan 1, 2010
19.525 mln
+1.719 mln
9.66%
jan 1, 2011
20.874 mln
+1.349 mln
6.91%
jan 1, 2012
21.698 mln
+824.46K
3.95%
jan 1, 2013
23.909 mln
+2.211 mln
10.19%
jan 1, 2014
27.591 mln
+3.681 mln
15.4%
Ranking of countries by current statistics by years


Comments: