30
/
AIzaSyAYiBZKx7MnpbEhh9jyipgxe19OcubqV5w
April 1, 2024
182417
Luxembourg
LUX
true
2
1
Other expense (current LCU)
2015,2014,2013,2012,2011,2010,2009,2008,2007,2006,2005,2004,2003,2002,2001,2000,1998,1997,1996,1995,1994,1993,1992,1991
Public Timelines
FAQ
Menu
Public Timelines
FAQ
For education
For educational institutions
For teachers
For students
Open cabinet
Create
Close
Create a timeline
Public timelines
Library
FAQ
Download
Global statistics library
→
Luxembourg
→
Other expense (current LCU)
This statistics in other country:
Afghanistan
Albania
Algeria
Angola
Armenia
Australia
Austria
Azerbaijan
Bahrain
Bangladesh
Barbados
Belarus
Belgium
Belize
Benin
Bhutan
Bolivia
Bosnia and Herzegovina
Botswana
Brazil
Bulgaria
Burkina Faso
Burundi
Cabo Verde
Cambodia
Canada
Central African Republic
Chile
Colombia
Congo, Dem. Rep.
Congo, Rep.
Costa Rica
Cote d'Ivoire
Croatia
Cyprus
Czech Republic
Denmark
Dominican Republic
Egypt, Arab Rep.
El Salvador
Equatorial Guinea
Estonia
Ethiopia
Fiji
Finland
France
Gambia, The
Georgia
Germany
Ghana
Greece
Grenada
Guatemala
Honduras
Hong Kong SAR, China
Hungary
Iceland
India
Indonesia
Iran, Islamic Rep.
Iraq
Ireland
Israel
Italy
Jamaica
Japan
Jordan
Kazakhstan
Kenya
Kiribati
Korea, Rep.
Kuwait
Kyrgyz Republic
Lao PDR
Latvia
Lebanon
Lesotho
Lithuania
Luxembourg
Macao SAR, China
Macedonia, FYR
Madagascar
Malawi
Malaysia
Maldives
Mali
Malta
Mauritius
Micronesia, Fed. Sts.
Moldova
Mongolia
Morocco
Mozambique
Namibia
Nepal
Netherlands
New Zealand
Nicaragua
Norway
Oman
Pakistan
Panama
Papua New Guinea
Paraguay
Peru
Philippines
Poland
Portugal
Qatar
Romania
Russian Federation
Rwanda
Samoa
San Marino
Sao Tome and Principe
Serbia
Seychelles
Sierra Leone
Slovak Republic
Slovenia
Solomon Islands
South Africa
Spain
Sri Lanka
Suriname
Swaziland
Sweden
Switzerland
Tajikistan
Tanzania
Thailand
Timor-Leste
Togo
Trinidad and Tobago
Tunisia
Turkey
Uganda
Ukraine
United Arab Emirates
United Kingdom
United States
Uruguay
Vanuatu
Venezuela, RB
West Bank and Gaza
Yemen, Rep.
Zambia
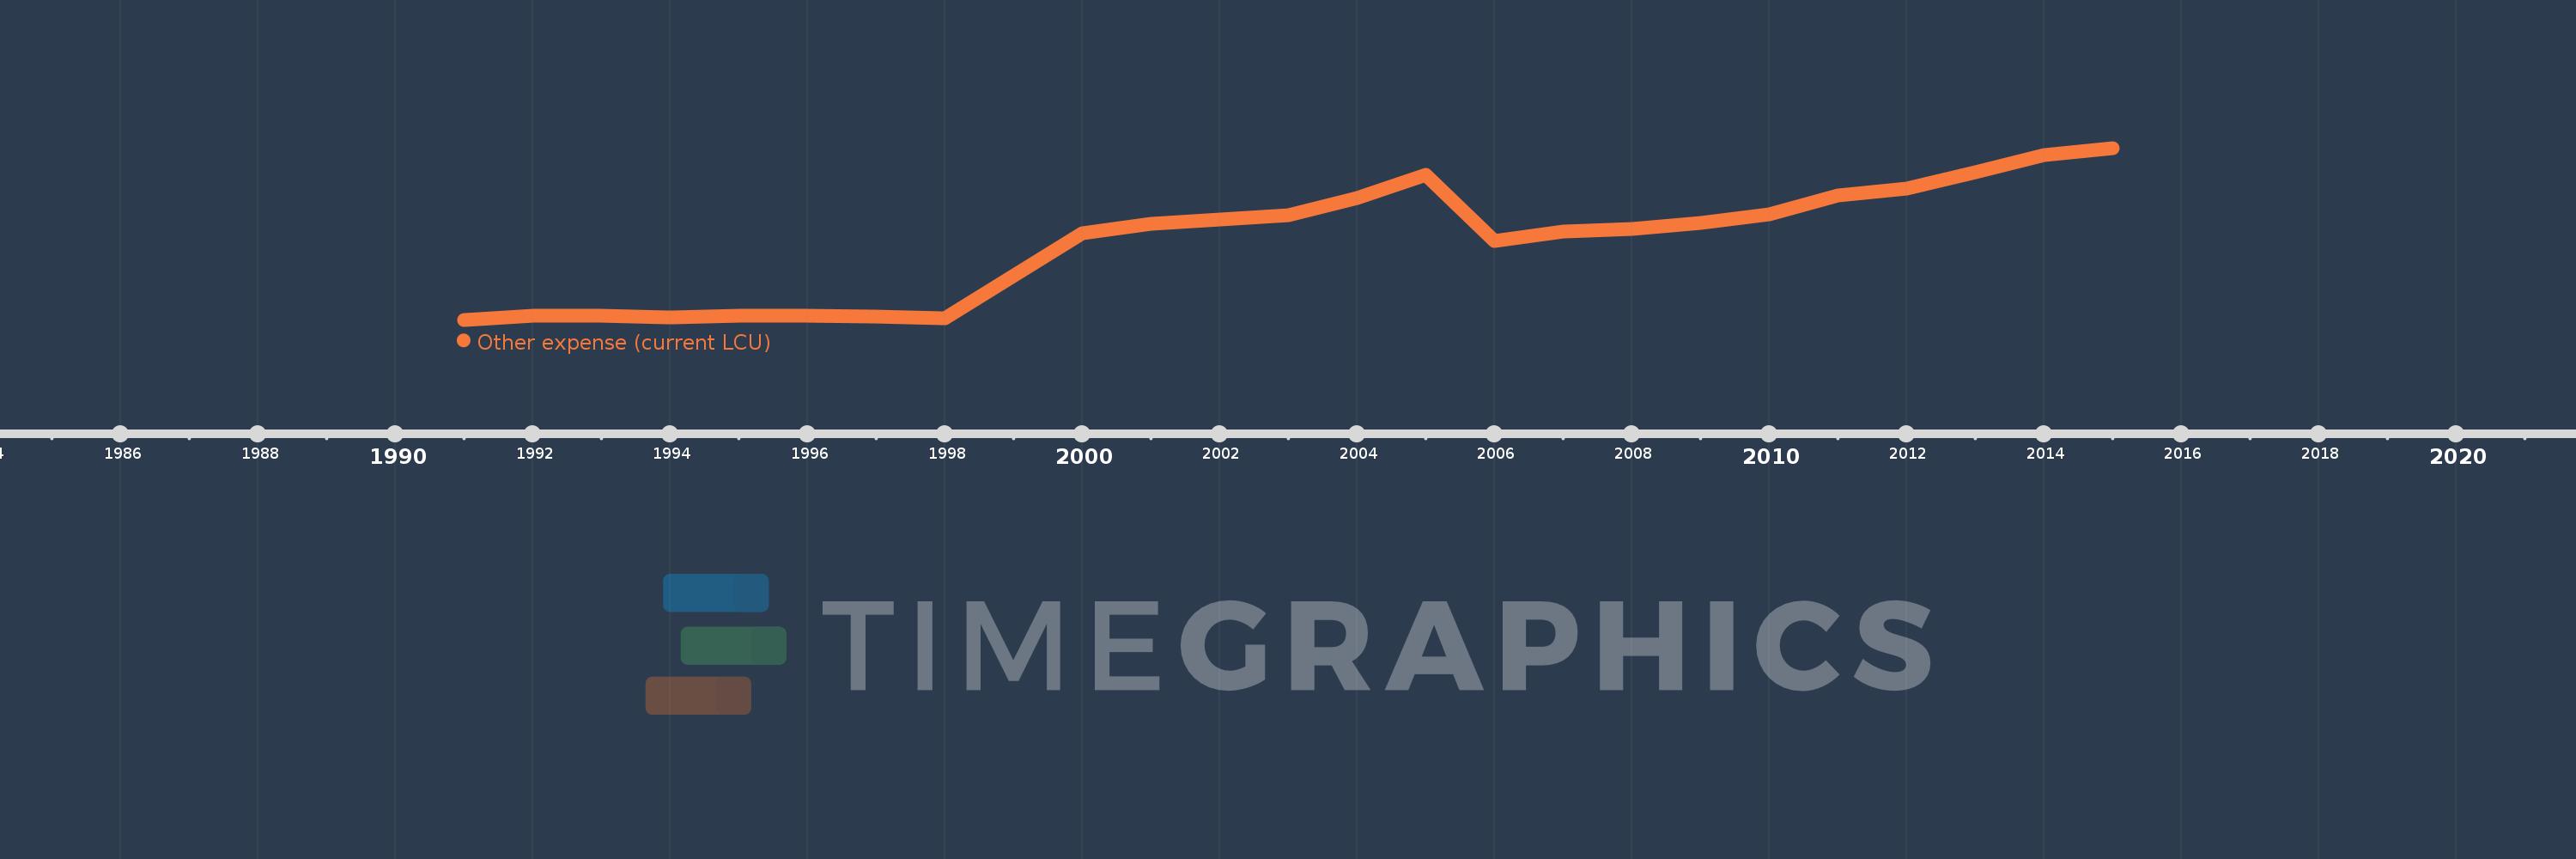
Timeline:
This timeline shows a graph from
1991
to
2015
of Luxembourg. No data until
1990
. Number of actual observations by date:
24
.
Source name:
World Development Indicators
Source organization:
International Monetary Fund, Government Finance Statistics Yearbook and data files.
Categories, topics:
Public Sector
Last updated:
apr 23, 2017
Indicators value changes by year
Meaning:
804.496 mln
Minimum:
112.742 mln
jan 1, 1991
Maximum:
1.634 bln
jan 1, 2015
At the date of observation
Value
Absolute change
Change from the previous value
jan 1, 1991
112.742 mln
+112.742 mln
0.0%
jan 1, 1992
147.893 mln
+35.151 mln
31.18%
jan 1, 1993
150.769 mln
+2.876 mln
1.94%
jan 1, 1994
131.83 mln
-18.939 mln
-12.56%
jan 1, 1995
146.431 mln
+14.601 mln
11.08%
jan 1, 1996
147.67 mln
+1.239 mln
0.85%
jan 1, 1997
144.529 mln
-3.141 mln
-2.13%
jan 1, 1998
125.087 mln
-19.442 mln
-13.45%
jan 1, 2000
876.694 mln
+751.607 mln
600.87%
jan 1, 2001
960.776 mln
+84.082 mln
9.59%
jan 1, 2002
997.166 mln
+36.389 mln
3.79%
jan 1, 2003
1.041 bln
+43.595 mln
4.37%
jan 1, 2004
1.192 bln
+151.44 mln
14.55%
jan 1, 2005
1.395 bln
+202.377 mln
16.98%
jan 1, 2006
807.111 mln
-587.466 mln
-42.13%
jan 1, 2007
892.619 mln
+85.508 mln
10.59%
jan 1, 2008
915.94 mln
+23.321 mln
2.61%
jan 1, 2009
969.064 mln
+53.123 mln
5.8%
jan 1, 2010
1.044 bln
+75.349 mln
7.78%
jan 1, 2011
1.213 bln
+168.349 mln
16.12%
jan 1, 2012
1.276 bln
+63.225 mln
5.21%
jan 1, 2013
1.416 bln
+140.427 mln
11.01%
jan 1, 2014
1.57 bln
+153.791 mln
10.86%
jan 1, 2015
1.634 bln
+64.066 mln
4.08%
Ranking of countries by current statistics by years
About & Feedback
Terms
Privacy
Library
2024
©
Time.Graphics
Support 24/7
Cabinet
Get premium
Donate
The service accepts bank transfer (ACH, Wire) or cards (Visa, MasterCard, etc). Processed by Stripe.
Secured with SSL
Excellent (Trustpilot Reviews)
Based on 115+ reviews
Write your own review on
Trustpilot.com
