29
/
en
AIzaSyAYiBZKx7MnpbEhh9jyipgxe19OcubqV5w
April 1, 2024
181481
Lithuania
LTU
true
2
1
Other expense (current LCU)
2015,2014,2013,2012,2011,2010,2009,2008,2007,2006,2005,2004,2003,2002,2001,2000,1999,1998,1997,1996
This statistics in other country:
AfghanistanAlbaniaAlgeriaAngolaArmeniaAustraliaAustriaAzerbaijanBahrainBangladeshBarbadosBelarusBelgiumBelizeBeninBhutanBoliviaBosnia and HerzegovinaBotswanaBrazilBulgariaBurkina FasoBurundiCabo VerdeCambodiaCanadaCentral African RepublicChileColombiaCongo, Dem. Rep.Congo, Rep.Costa RicaCote d'IvoireCroatiaCyprusCzech RepublicDenmarkDominican RepublicEgypt, Arab Rep.El SalvadorEquatorial GuineaEstoniaEthiopiaFijiFinlandFranceGambia, TheGeorgiaGermanyGhanaGreeceGrenadaGuatemalaHondurasHong Kong SAR, ChinaHungaryIcelandIndiaIndonesiaIran, Islamic Rep.IraqIrelandIsraelItalyJamaicaJapanJordanKazakhstanKenyaKiribatiKorea, Rep.KuwaitKyrgyz RepublicLao PDRLatviaLebanonLesothoLithuaniaLuxembourgMacao SAR, ChinaMacedonia, FYRMadagascarMalawiMalaysiaMaldivesMaliMaltaMauritiusMicronesia, Fed. Sts.MoldovaMongoliaMoroccoMozambiqueNamibiaNepalNetherlandsNew ZealandNicaraguaNorwayOmanPakistanPanamaPapua New GuineaParaguayPeruPhilippinesPolandPortugalQatarRomaniaRussian FederationRwandaSamoaSan MarinoSao Tome and PrincipeSerbiaSeychellesSierra LeoneSlovak RepublicSloveniaSolomon IslandsSouth AfricaSpainSri LankaSurinameSwazilandSwedenSwitzerlandTajikistanTanzaniaThailandTimor-LesteTogoTrinidad and TobagoTunisiaTurkeyUgandaUkraineUnited Arab EmiratesUnited KingdomUnited StatesUruguayVanuatuVenezuela, RBWest Bank and GazaYemen, Rep.Zambia Timeline:
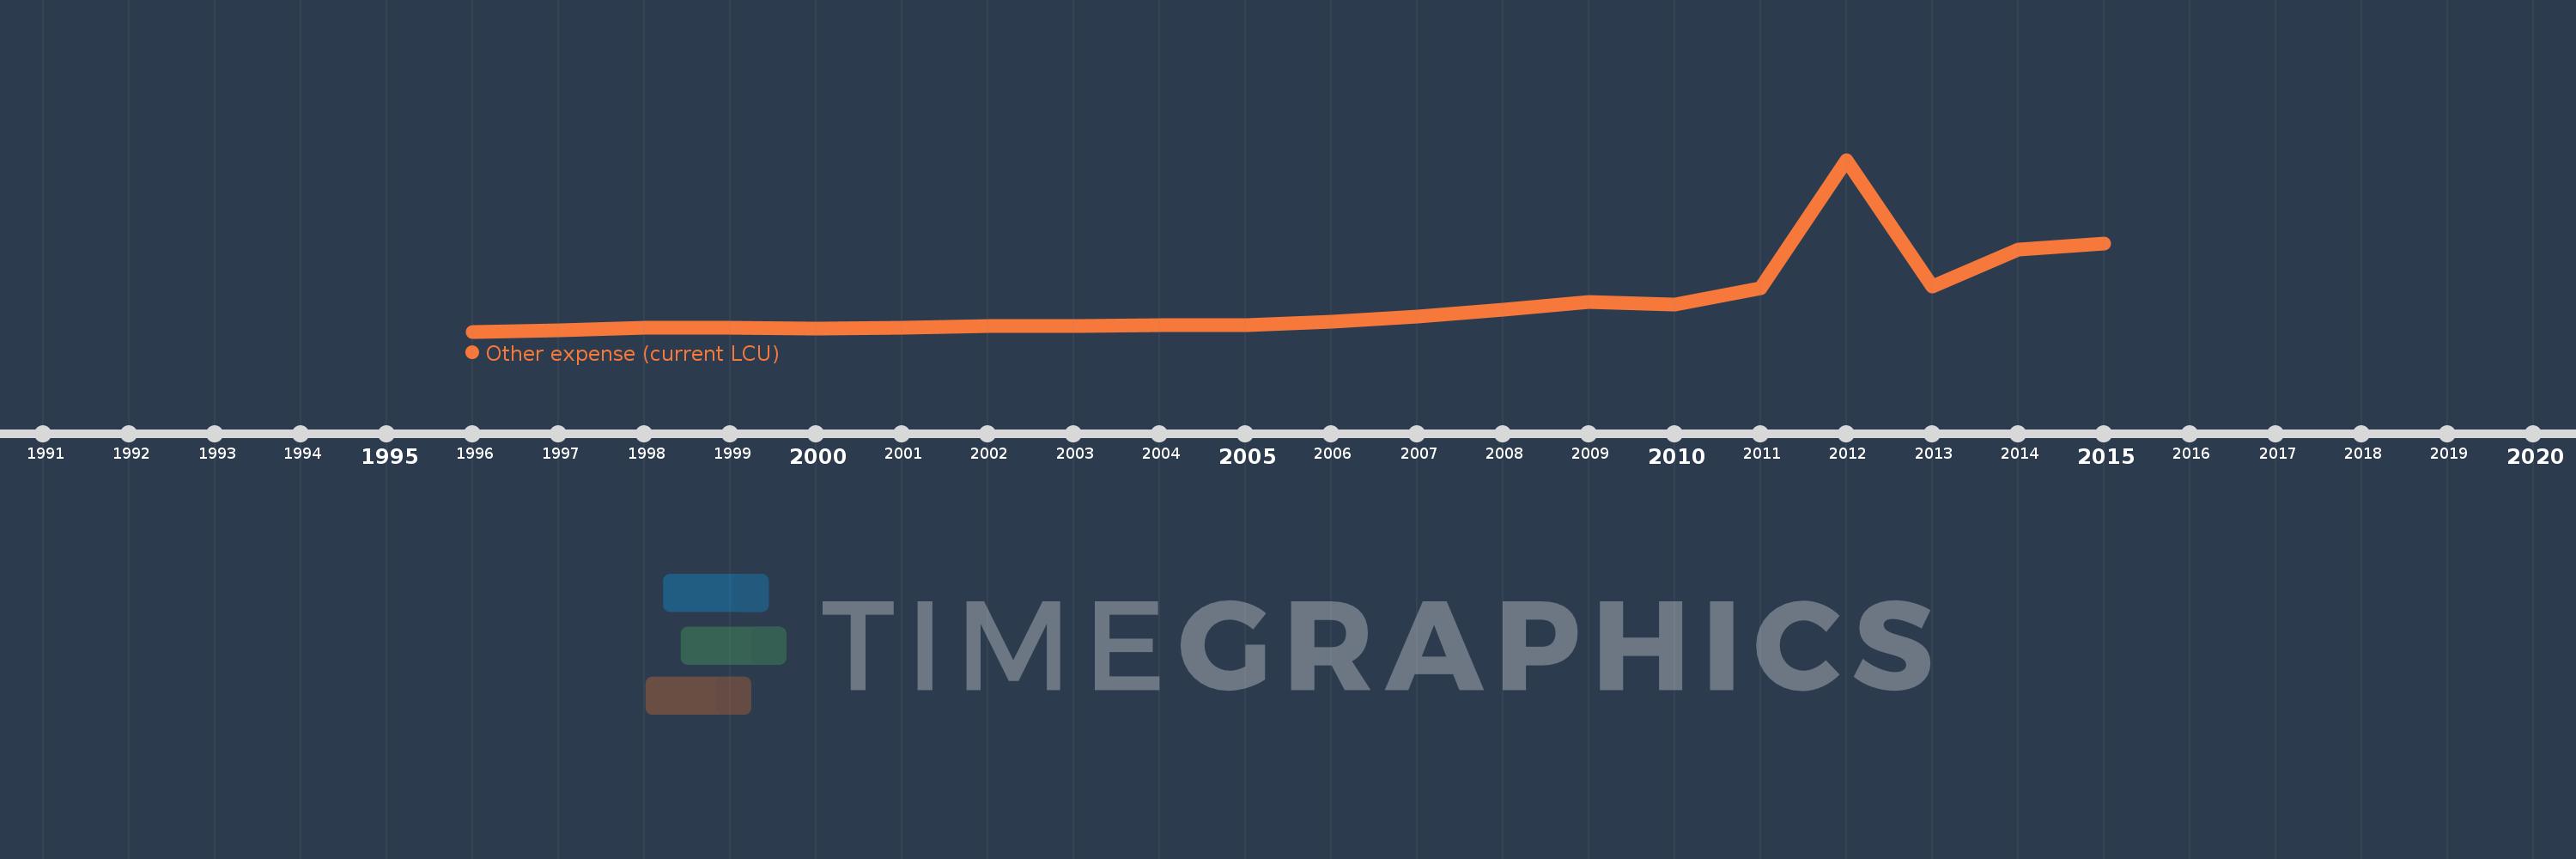
This timeline shows a graph from 1996 to 2015 of Lithuania. No data until 1995. Number of actual observations by date: 20.
Source name:
World Development Indicators
Source organization:
International Monetary Fund, Government Finance Statistics Yearbook and data files.
Categories, topics:
Public Sector
Last updated:
apr 23, 2017
Indicators value changes by year
Minimum:
44.636 mln
jan 1, 1996
Maximum:
570.059 mln
jan 1, 2012
At the date of observation
Value
Absolute change
Change from previous value
jan 1, 1996
44.636 mln
+44.636 mln
0.0%
jan 1, 1997
49.65 mln
+5.013 mln
11.23%
jan 1, 1998
55.21 mln
+5.561 mln
11.2%
jan 1, 1999
57.185 mln
+1.975 mln
3.58%
jan 1, 2000
54.48 mln
-2.705 mln
-4.73%
jan 1, 2001
57.498 mln
+3.018 mln
5.54%
jan 1, 2002
61.237 mln
+3.739 mln
6.5%
jan 1, 2003
61.976 mln
+738.531K
1.21%
jan 1, 2004
64.015 mln
+2.039 mln
3.29%
jan 1, 2005
65.619 mln
+1.604 mln
2.51%
jan 1, 2006
76.158 mln
+10.539 mln
16.06%
jan 1, 2007
91.882 mln
+15.723 mln
20.65%
jan 1, 2008
111.119 mln
+19.237 mln
20.94%
jan 1, 2009
134.401 mln
+23.283 mln
20.95%
jan 1, 2010
128.027 mln
-6.375 mln
-4.74%
jan 1, 2011
178.583 mln
+50.556 mln
39.49%
jan 1, 2012
570.059 mln
+391.476 mln
219.21%
jan 1, 2013
182.704 mln
-387.355 mln
-67.95%
jan 1, 2014
294.315 mln
+111.611 mln
61.09%
jan 1, 2015
314.154 mln
+19.839 mln
6.74%
Ranking of countries by current statistics by years


Comments: