29
/
en
AIzaSyAYiBZKx7MnpbEhh9jyipgxe19OcubqV5w
April 1, 2024
272701
Uganda
UGA
true
2
1
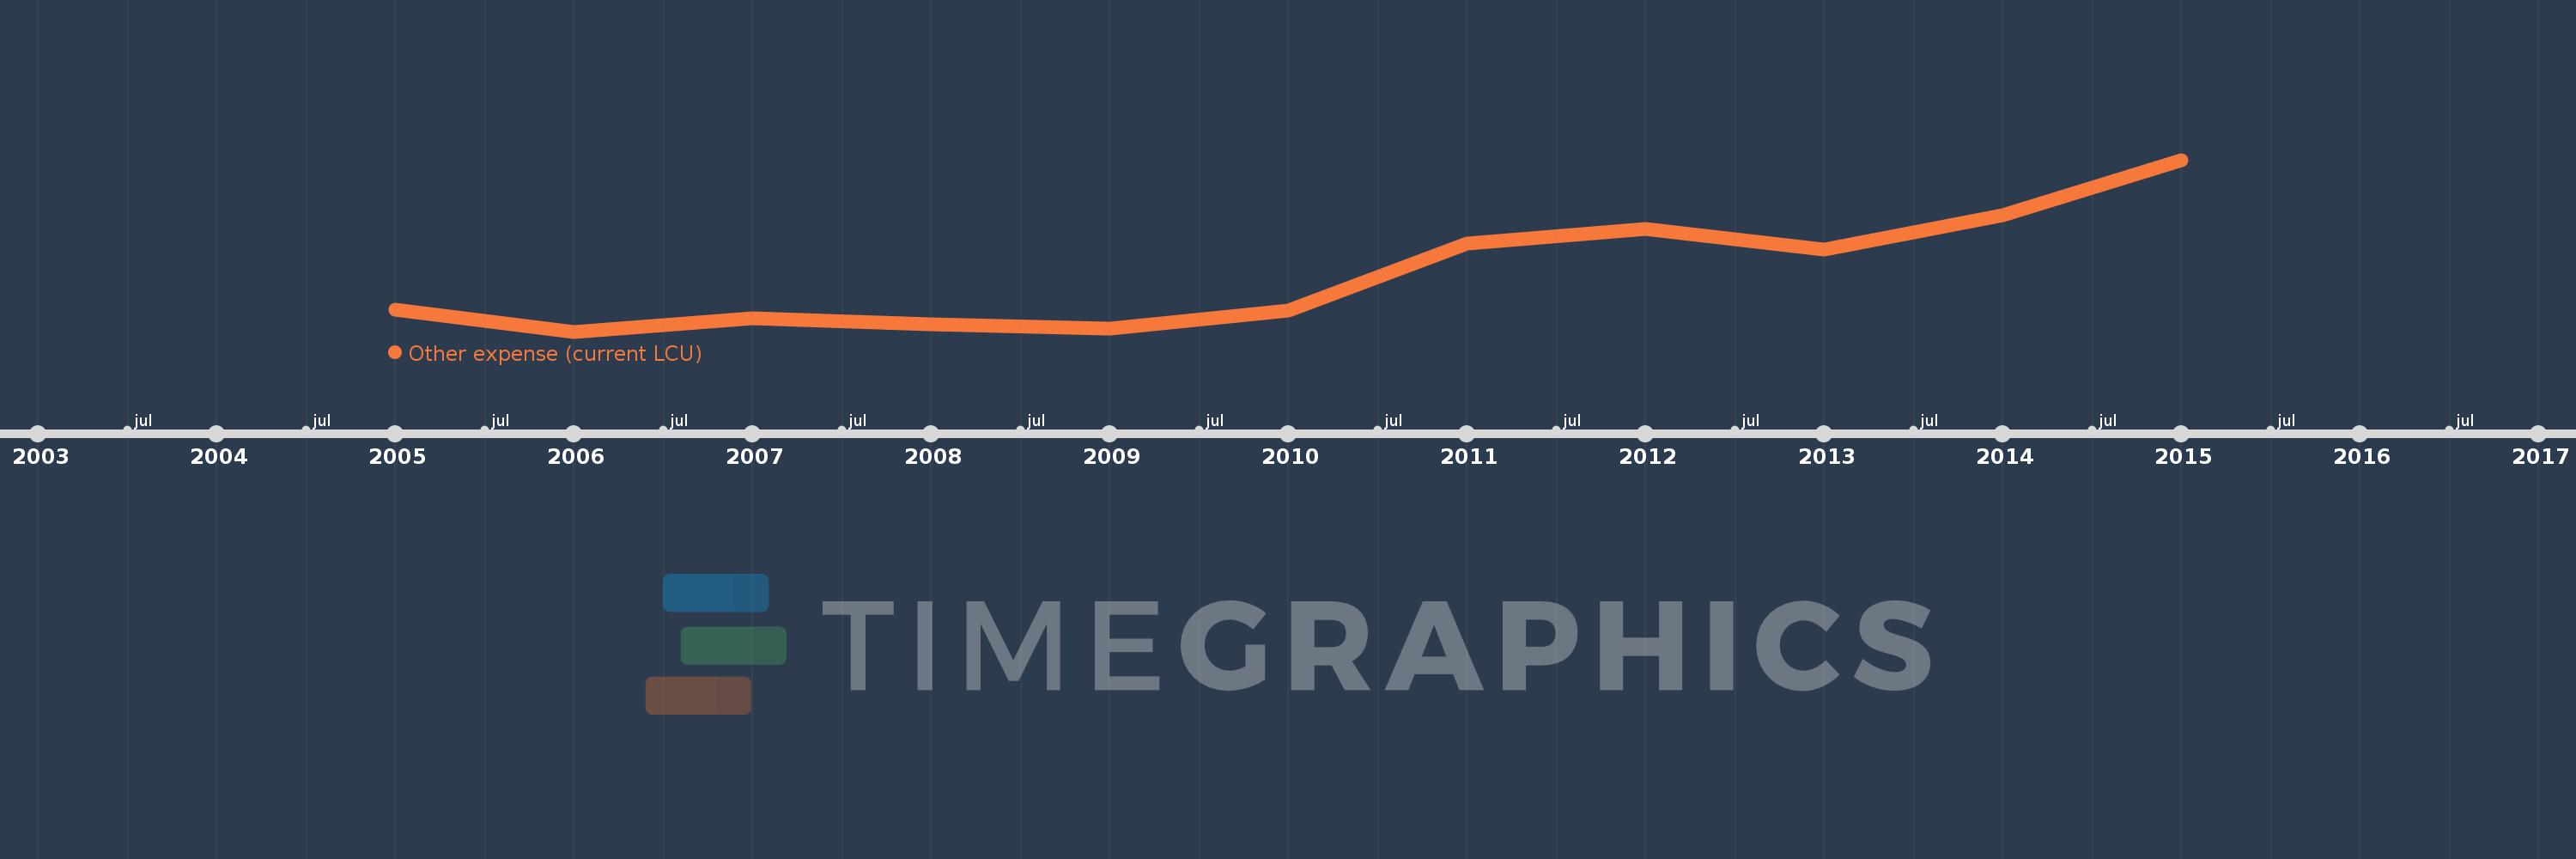
Other expense (current LCU)
2015,2014,2013,2012,2011,2010,2009,2008,2007,2006,2005
This statistics in other country:
AfghanistanAlbaniaAlgeriaAngolaArmeniaAustraliaAustriaAzerbaijanBahrainBangladeshBarbadosBelarusBelgiumBelizeBeninBhutanBoliviaBosnia and HerzegovinaBotswanaBrazilBulgariaBurkina FasoBurundiCabo VerdeCambodiaCanadaCentral African RepublicChileColombiaCongo, Dem. Rep.Congo, Rep.Costa RicaCote d'IvoireCroatiaCyprusCzech RepublicDenmarkDominican RepublicEgypt, Arab Rep.El SalvadorEquatorial GuineaEstoniaEthiopiaFijiFinlandFranceGambia, TheGeorgiaGermanyGhanaGreeceGrenadaGuatemalaHondurasHong Kong SAR, ChinaHungaryIcelandIndiaIndonesiaIran, Islamic Rep.IraqIrelandIsraelItalyJamaicaJapanJordanKazakhstanKenyaKiribatiKorea, Rep.KuwaitKyrgyz RepublicLao PDRLatviaLebanonLesothoLithuaniaLuxembourgMacao SAR, ChinaMacedonia, FYRMadagascarMalawiMalaysiaMaldivesMaliMaltaMauritiusMicronesia, Fed. Sts.MoldovaMongoliaMoroccoMozambiqueNamibiaNepalNetherlandsNew ZealandNicaraguaNorwayOmanPakistanPanamaPapua New GuineaParaguayPeruPhilippinesPolandPortugalQatarRomaniaRussian FederationRwandaSamoaSan MarinoSao Tome and PrincipeSerbiaSeychellesSierra LeoneSlovak RepublicSloveniaSolomon IslandsSouth AfricaSpainSri LankaSurinameSwazilandSwedenSwitzerlandTajikistanTanzaniaThailandTimor-LesteTogoTrinidad and TobagoTunisiaTurkeyUgandaUkraineUnited Arab EmiratesUnited KingdomUnited StatesUruguayVanuatuVenezuela, RBWest Bank and GazaYemen, Rep.Zambia Timeline:
This timeline shows a graph from 2005 to 2015 of Uganda. No data until 2004. Number of actual observations by date: 11.
Source name:
World Development Indicators
Source organization:
International Monetary Fund, Government Finance Statistics Yearbook and data files.
Categories, topics:
Public Sector
Last updated:
apr 23, 2017
Indicators value changes by year
Minimum:
9.887 bln
jan 1, 2006
Maximum:
415.013 bln
jan 1, 2015
At the date of observation
Value
Absolute change
Change from previous value
jan 1, 2005
60.64 bln
+60.64 bln
0.0%
jan 1, 2006
9.887 bln
-50.753 bln
-83.7%
jan 1, 2007
41.614 bln
+31.727 bln
320.89%
jan 1, 2008
26.43 bln
-15.184 bln
-36.49%
jan 1, 2009
16.043 bln
-10.388 bln
-39.3%
jan 1, 2010
59.953 bln
+43.91 bln
273.71%
jan 1, 2011
218.076 bln
+158.123 bln
263.75%
jan 1, 2012
252.085 bln
+34.009 bln
15.6%
jan 1, 2013
202.564 bln
-49.521 bln
-19.64%
jan 1, 2014
283.708 bln
+81.144 bln
40.06%
jan 1, 2015
415.013 bln
+131.305 bln
46.28%
Ranking of countries by current statistics by years


Comments: