29
/
en
AIzaSyAYiBZKx7MnpbEhh9jyipgxe19OcubqV5w
April 1, 2024
233961
Sao Tome and Principe
STP
true
2
1
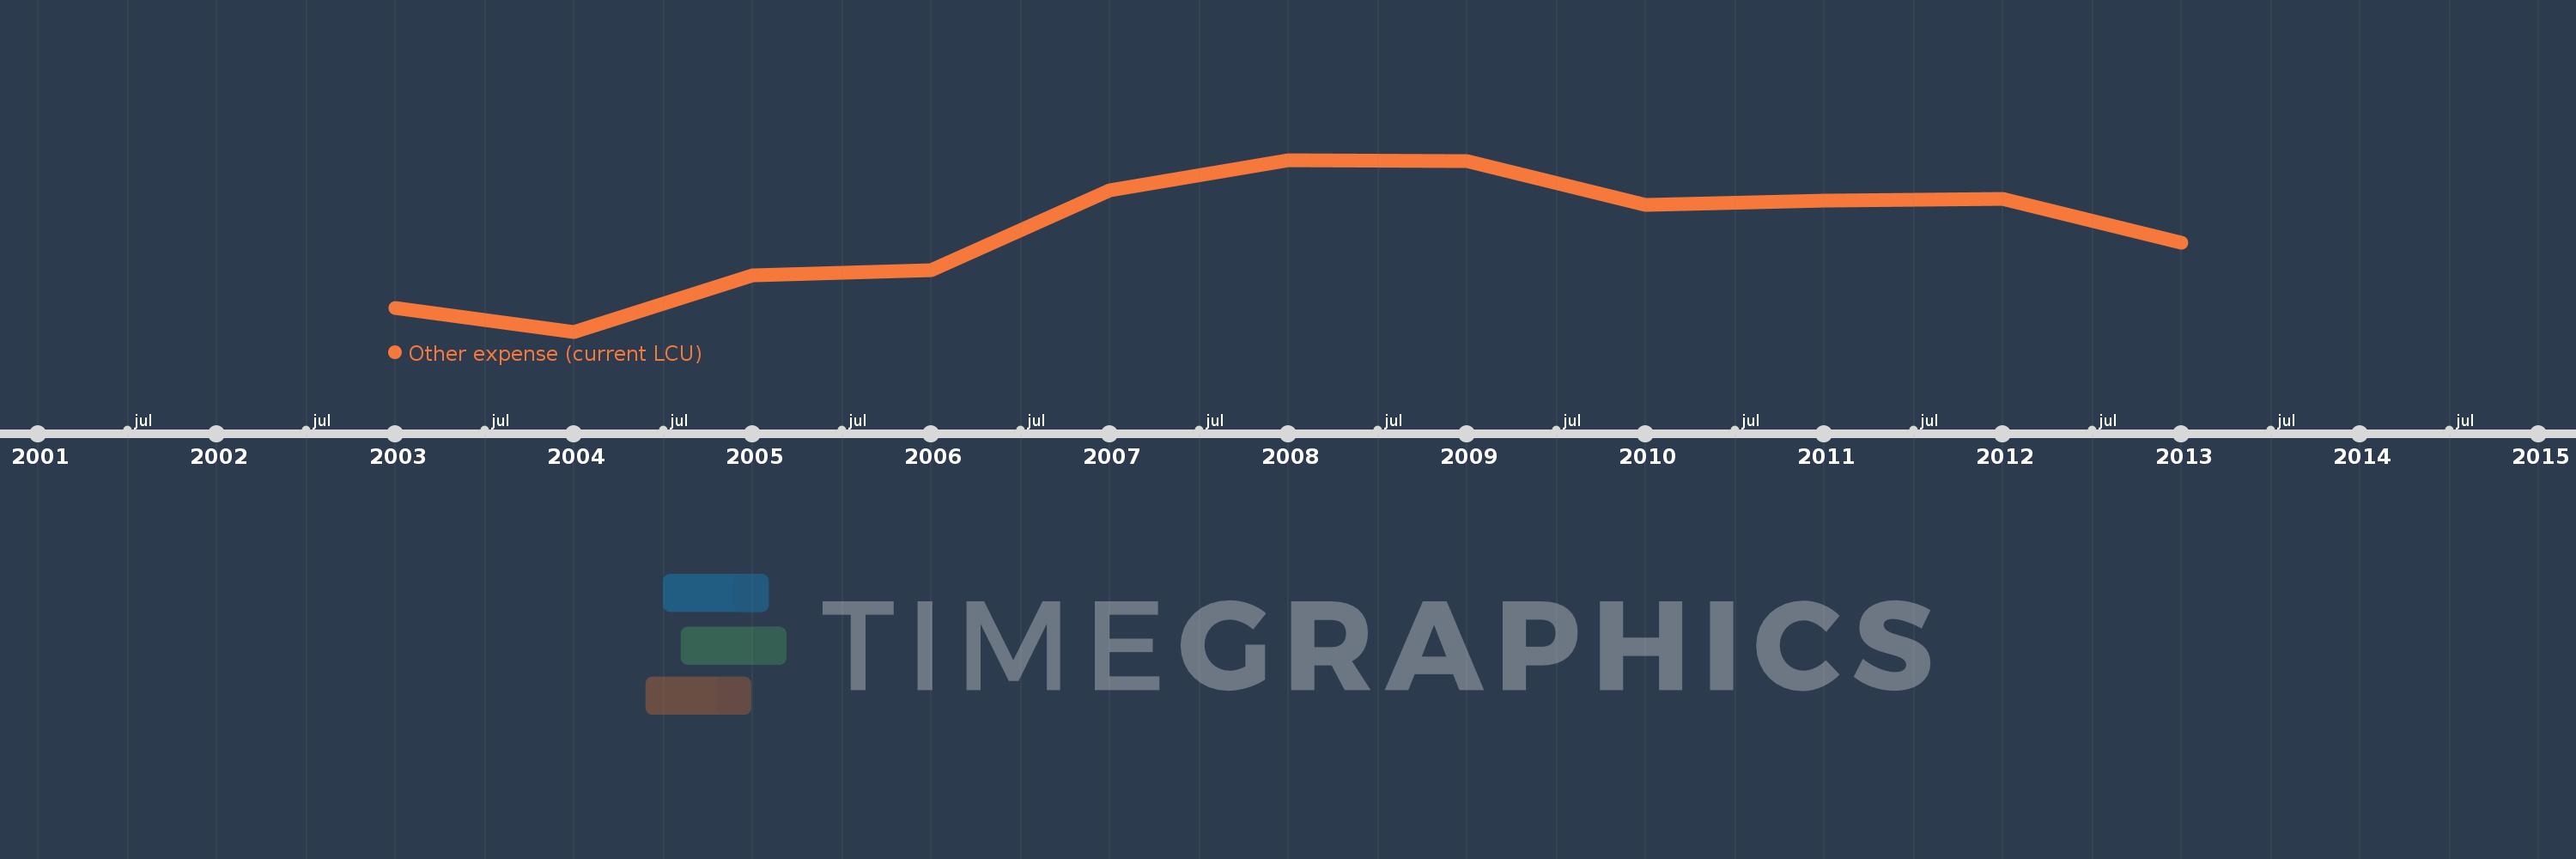
Other expense (current LCU)
2013,2012,2011,2010,2009,2008,2007,2006,2005,2004,2003
This statistics in other country:
AfghanistanAlbaniaAlgeriaAngolaArmeniaAustraliaAustriaAzerbaijanBahrainBangladeshBarbadosBelarusBelgiumBelizeBeninBhutanBoliviaBosnia and HerzegovinaBotswanaBrazilBulgariaBurkina FasoBurundiCabo VerdeCambodiaCanadaCentral African RepublicChileColombiaCongo, Dem. Rep.Congo, Rep.Costa RicaCote d'IvoireCroatiaCyprusCzech RepublicDenmarkDominican RepublicEgypt, Arab Rep.El SalvadorEquatorial GuineaEstoniaEthiopiaFijiFinlandFranceGambia, TheGeorgiaGermanyGhanaGreeceGrenadaGuatemalaHondurasHong Kong SAR, ChinaHungaryIcelandIndiaIndonesiaIran, Islamic Rep.IraqIrelandIsraelItalyJamaicaJapanJordanKazakhstanKenyaKiribatiKorea, Rep.KuwaitKyrgyz RepublicLao PDRLatviaLebanonLesothoLithuaniaLuxembourgMacao SAR, ChinaMacedonia, FYRMadagascarMalawiMalaysiaMaldivesMaliMaltaMauritiusMicronesia, Fed. Sts.MoldovaMongoliaMoroccoMozambiqueNamibiaNepalNetherlandsNew ZealandNicaraguaNorwayOmanPakistanPanamaPapua New GuineaParaguayPeruPhilippinesPolandPortugalQatarRomaniaRussian FederationRwandaSamoaSan MarinoSao Tome and PrincipeSerbiaSeychellesSierra LeoneSlovak RepublicSloveniaSolomon IslandsSouth AfricaSpainSri LankaSurinameSwazilandSwedenSwitzerlandTajikistanTanzaniaThailandTimor-LesteTogoTrinidad and TobagoTunisiaTurkeyUgandaUkraineUnited Arab EmiratesUnited KingdomUnited StatesUruguayVanuatuVenezuela, RBWest Bank and GazaYemen, Rep.Zambia Timeline:
This timeline shows a graph from 2003 to 2013 of Sao Tome and Principe. No data until 2002. Number of actual observations by date: 11.
Source name:
World Development Indicators
Source organization:
International Monetary Fund, Government Finance Statistics Yearbook and data files.
Categories, topics:
Public Sector
Last updated:
apr 23, 2017
Indicators value changes by year
Minimum:
25.292 bln
jan 1, 2004
Maximum:
102.63 bln
jan 1, 2008
At the date of observation
Value
Absolute change
Change from previous value
jan 1, 2003
35.928 bln
+35.928 bln
0.0%
jan 1, 2004
25.292 bln
-10.636 bln
-29.6%
jan 1, 2005
50.767 bln
+25.475 bln
100.72%
jan 1, 2006
52.78 bln
+2.013 bln
3.97%
jan 1, 2007
88.73 bln
+35.95 bln
68.11%
jan 1, 2008
102.63 bln
+13.9 bln
15.67%
jan 1, 2009
102.051 bln
-578.904 mln
-0.56%
jan 1, 2010
82.182 bln
-19.869 bln
-19.47%
jan 1, 2011
84.37 bln
+2.188 bln
2.66%
jan 1, 2012
84.926 bln
+556.436 mln
0.66%
jan 1, 2013
65.435 bln
-19.491 bln
-22.95%
Ranking of countries by current statistics by years


Comments: