29
/
en
AIzaSyAYiBZKx7MnpbEhh9jyipgxe19OcubqV5w
April 1, 2024
82087
Belgium
BEL
true
2
1
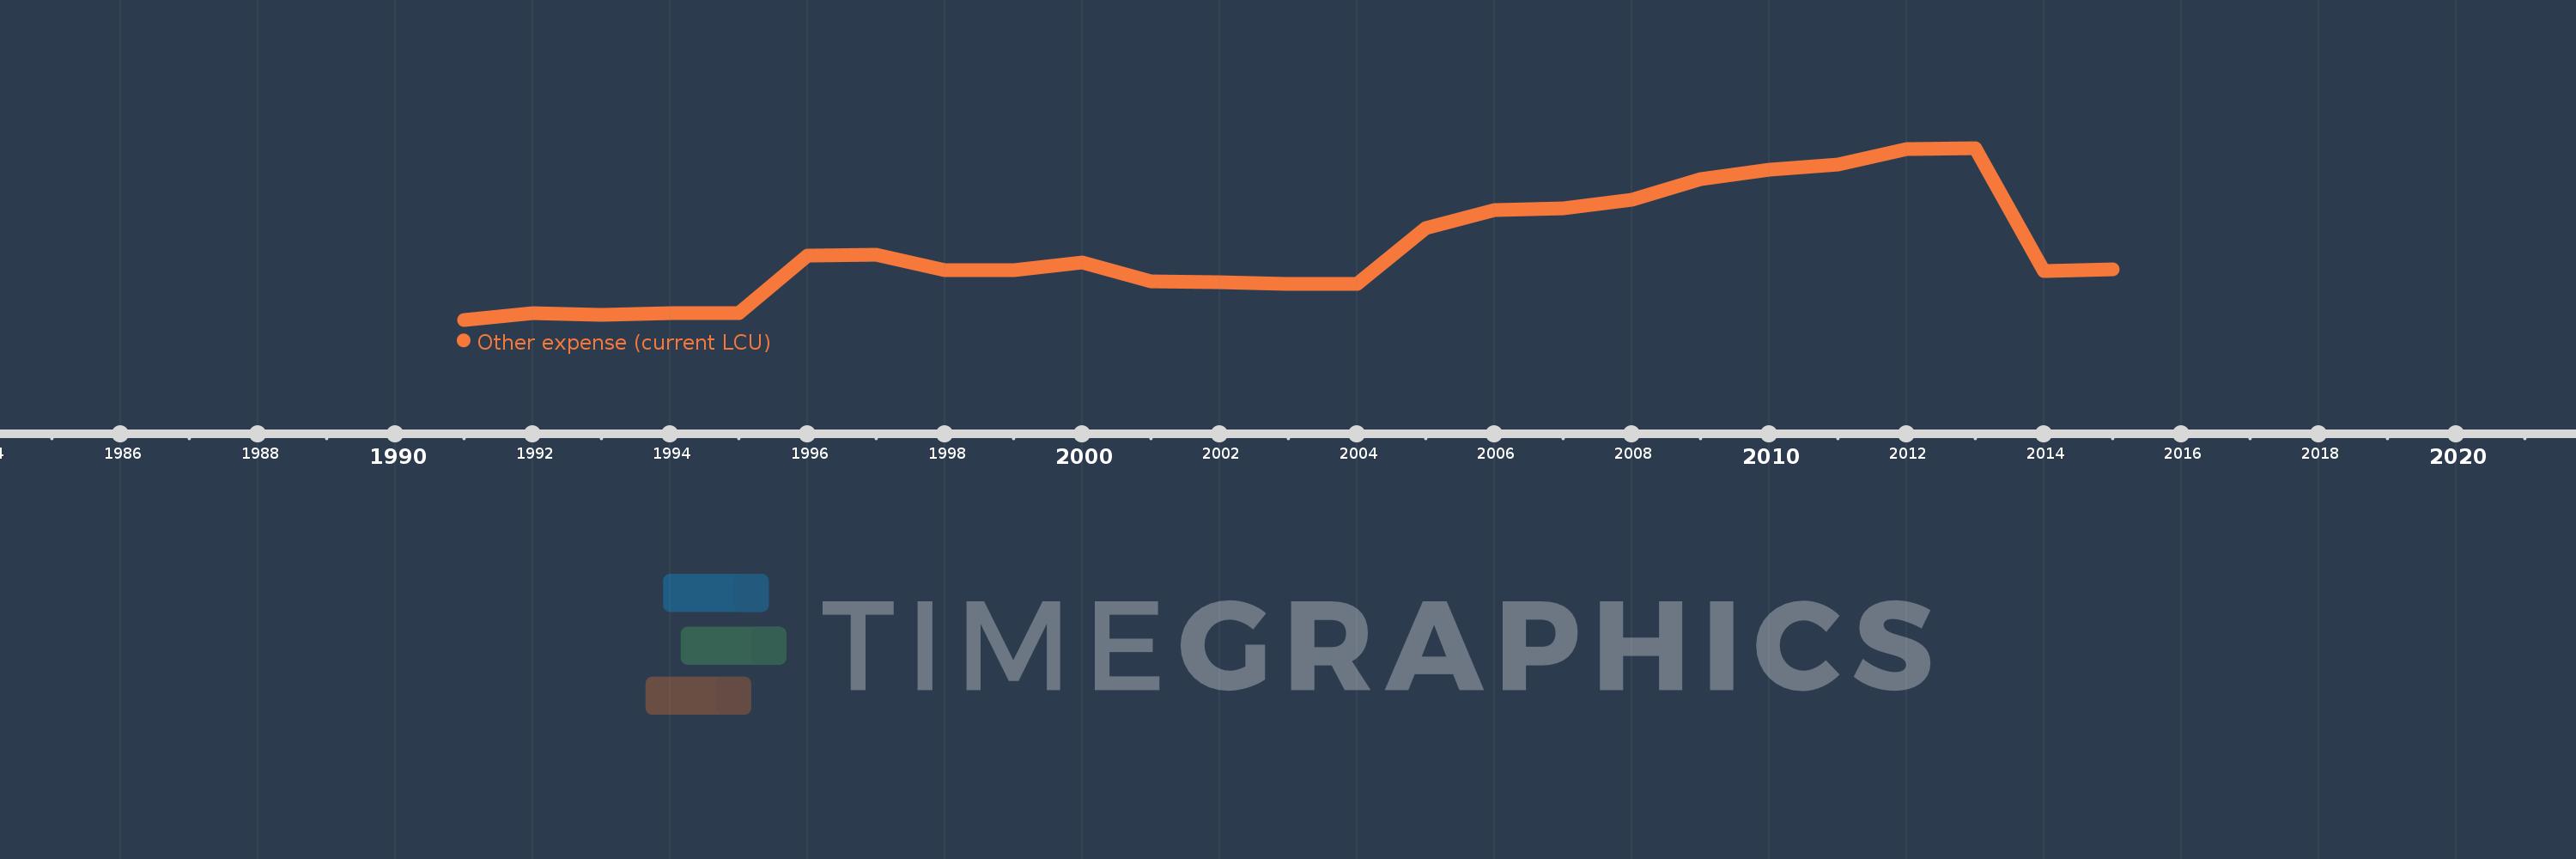
Other expense (current LCU)
2015,2014,2013,2012,2011,2010,2009,2008,2007,2006,2005,2004,2003,2002,2001,2000,1999,1998,1997,1996,1995,1994,1993,1992,1991
This statistics in other country:
AfghanistanAlbaniaAlgeriaAngolaArmeniaAustraliaAustriaAzerbaijanBahrainBangladeshBarbadosBelarusBelgiumBelizeBeninBhutanBoliviaBosnia and HerzegovinaBotswanaBrazilBulgariaBurkina FasoBurundiCabo VerdeCambodiaCanadaCentral African RepublicChileColombiaCongo, Dem. Rep.Congo, Rep.Costa RicaCote d'IvoireCroatiaCyprusCzech RepublicDenmarkDominican RepublicEgypt, Arab Rep.El SalvadorEquatorial GuineaEstoniaEthiopiaFijiFinlandFranceGambia, TheGeorgiaGermanyGhanaGreeceGrenadaGuatemalaHondurasHong Kong SAR, ChinaHungaryIcelandIndiaIndonesiaIran, Islamic Rep.IraqIrelandIsraelItalyJamaicaJapanJordanKazakhstanKenyaKiribatiKorea, Rep.KuwaitKyrgyz RepublicLao PDRLatviaLebanonLesothoLithuaniaLuxembourgMacao SAR, ChinaMacedonia, FYRMadagascarMalawiMalaysiaMaldivesMaliMaltaMauritiusMicronesia, Fed. Sts.MoldovaMongoliaMoroccoMozambiqueNamibiaNepalNetherlandsNew ZealandNicaraguaNorwayOmanPakistanPanamaPapua New GuineaParaguayPeruPhilippinesPolandPortugalQatarRomaniaRussian FederationRwandaSamoaSan MarinoSao Tome and PrincipeSerbiaSeychellesSierra LeoneSlovak RepublicSloveniaSolomon IslandsSouth AfricaSpainSri LankaSurinameSwazilandSwedenSwitzerlandTajikistanTanzaniaThailandTimor-LesteTogoTrinidad and TobagoTunisiaTurkeyUgandaUkraineUnited Arab EmiratesUnited KingdomUnited StatesUruguayVanuatuVenezuela, RBWest Bank and GazaYemen, Rep.Zambia Timeline:
This timeline shows a graph from 1991 to 2015 of Belgium. No data until 1990. Number of actual observations by date: 25.
Source name:
World Development Indicators
Source organization:
International Monetary Fund, Government Finance Statistics Yearbook and data files.
Categories, topics:
Public Sector
Last updated:
apr 23, 2017
Indicators value changes by year
Minimum:
190.5 mln
jan 1, 1991
Maximum:
3.43 bln
jan 1, 2013
At the date of observation
Value
Absolute change
Change from previous value
jan 1, 1991
190.5 mln
+190.5 mln
0.0%
jan 1, 1992
311.6 mln
+121.1 mln
63.57%
jan 1, 1993
281.2 mln
-30.4 mln
-9.76%
jan 1, 1994
312.5 mln
+31.3 mln
11.13%
jan 1, 1995
317.5 mln
+5.0 mln
1.6%
jan 1, 1996
1.398 bln
+1.081 bln
340.44%
jan 1, 1997
1.419 bln
+20.5 mln
1.47%
jan 1, 1998
1.117 bln
-301.8 mln
-21.27%
jan 1, 1999
1.127 bln
+10.3 mln
0.92%
jan 1, 2000
1.264 bln
+136.9 mln
12.14%
jan 1, 2001
918.7 mln
-345.6 mln
-27.34%
jan 1, 2002
891.1 mln
-27.6 mln
-3.0%
jan 1, 2003
868.1 mln
-23.0 mln
-2.58%
jan 1, 2004
862.1 mln
-6.0 mln
-0.69%
jan 1, 2005
1.917 bln
+1.054 bln
122.32%
jan 1, 2006
2.266 bln
+349.4 mln
18.23%
jan 1, 2007
2.297 bln
+31.2 mln
1.38%
jan 1, 2008
2.449 bln
+151.8 mln
6.61%
jan 1, 2009
2.85 bln
+400.6 mln
16.36%
jan 1, 2010
3.019 bln
+169.5 mln
5.95%
jan 1, 2011
3.118 bln
+98.8 mln
3.27%
jan 1, 2012
3.408 bln
+289.6 mln
9.29%
jan 1, 2013
3.43 bln
+22.1 mln
0.65%
jan 1, 2014
1.116 bln
-2.313 bln
-67.45%
jan 1, 2015
1.148 bln
+32.0 mln
2.87%
Ranking of countries by current statistics by years


Comments: