29
/
en
AIzaSyAYiBZKx7MnpbEhh9jyipgxe19OcubqV5w
April 1, 2024
254485
Suriname
SUR
true
2
1
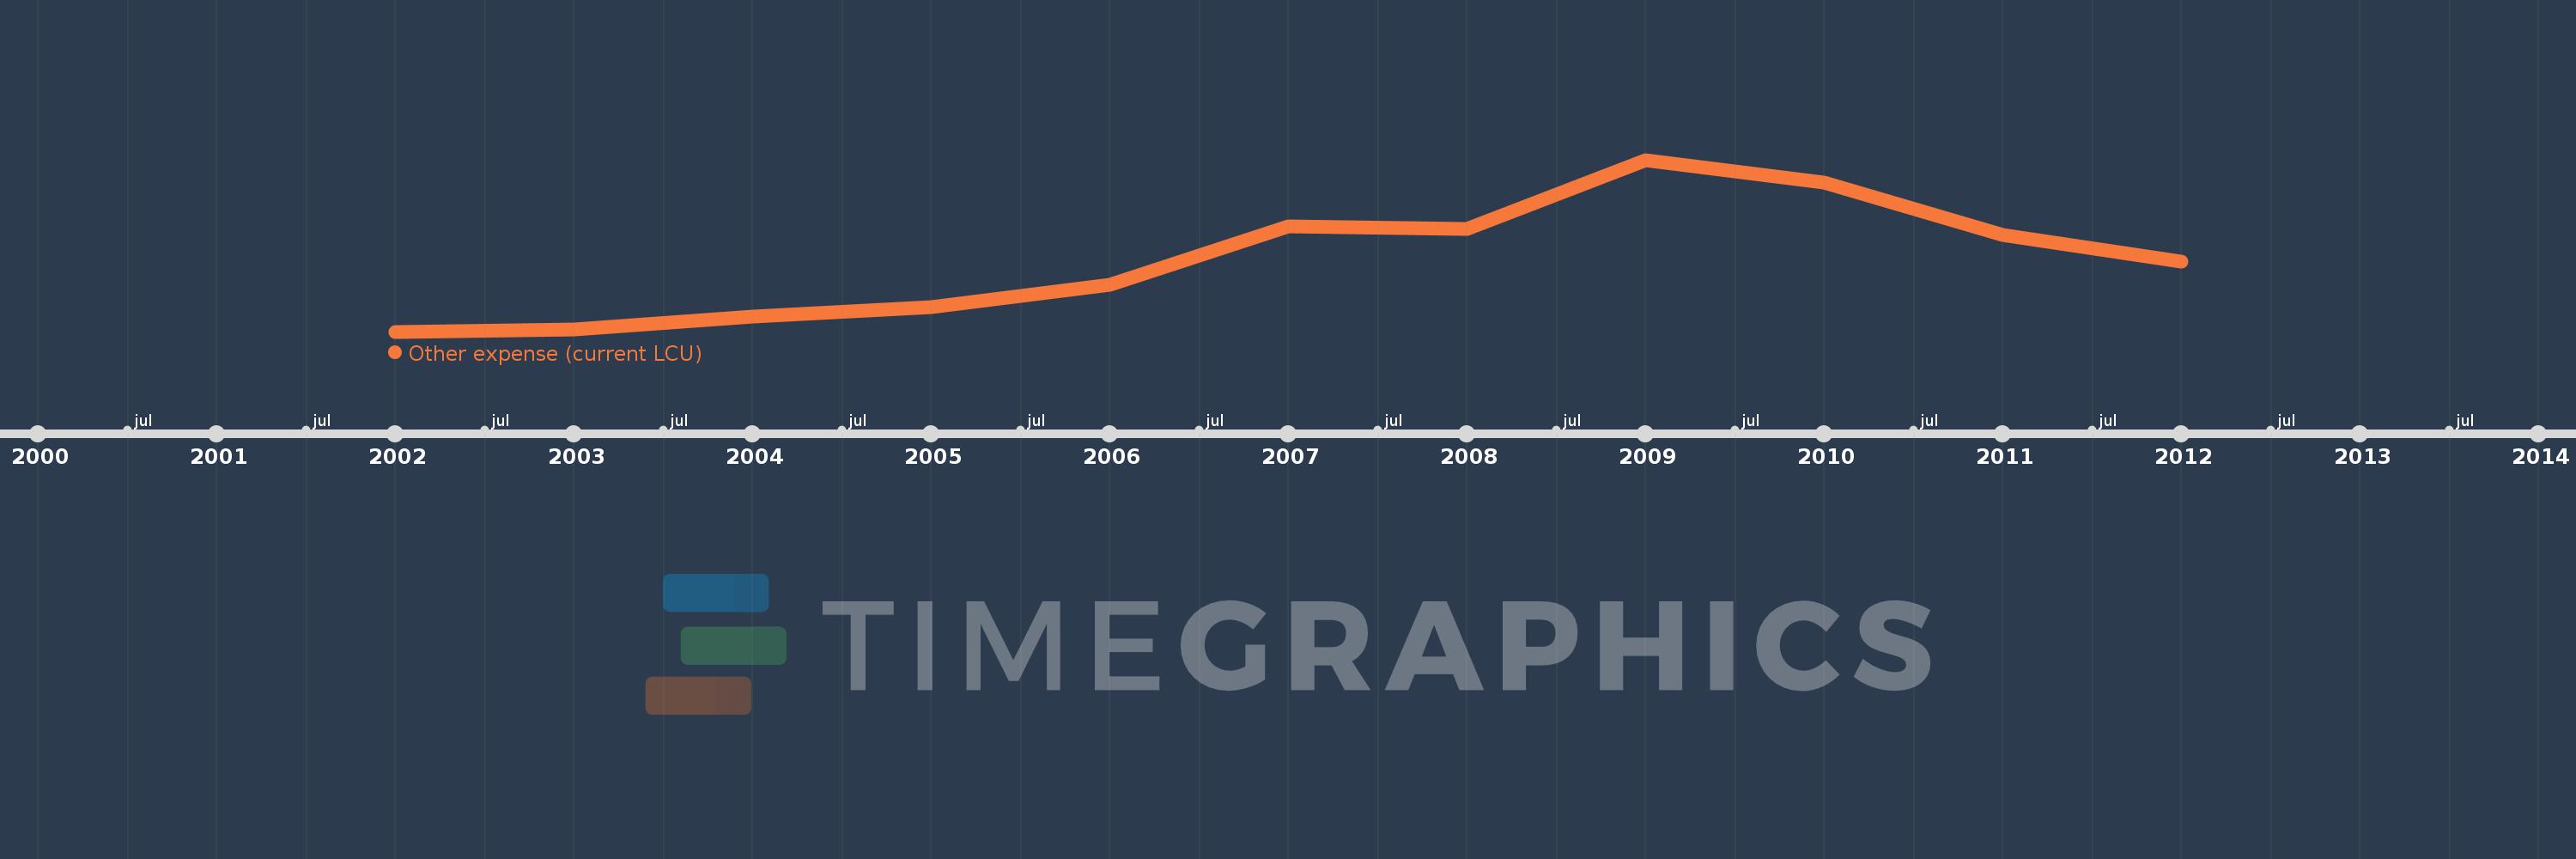
Other expense (current LCU)
2012,2011,2010,2009,2008,2007,2006,2005,2004,2003,2002
This statistics in other country:
AfghanistanAlbaniaAlgeriaAngolaArmeniaAustraliaAustriaAzerbaijanBahrainBangladeshBarbadosBelarusBelgiumBelizeBeninBhutanBoliviaBosnia and HerzegovinaBotswanaBrazilBulgariaBurkina FasoBurundiCabo VerdeCambodiaCanadaCentral African RepublicChileColombiaCongo, Dem. Rep.Congo, Rep.Costa RicaCote d'IvoireCroatiaCyprusCzech RepublicDenmarkDominican RepublicEgypt, Arab Rep.El SalvadorEquatorial GuineaEstoniaEthiopiaFijiFinlandFranceGambia, TheGeorgiaGermanyGhanaGreeceGrenadaGuatemalaHondurasHong Kong SAR, ChinaHungaryIcelandIndiaIndonesiaIran, Islamic Rep.IraqIrelandIsraelItalyJamaicaJapanJordanKazakhstanKenyaKiribatiKorea, Rep.KuwaitKyrgyz RepublicLao PDRLatviaLebanonLesothoLithuaniaLuxembourgMacao SAR, ChinaMacedonia, FYRMadagascarMalawiMalaysiaMaldivesMaliMaltaMauritiusMicronesia, Fed. Sts.MoldovaMongoliaMoroccoMozambiqueNamibiaNepalNetherlandsNew ZealandNicaraguaNorwayOmanPakistanPanamaPapua New GuineaParaguayPeruPhilippinesPolandPortugalQatarRomaniaRussian FederationRwandaSamoaSan MarinoSao Tome and PrincipeSerbiaSeychellesSierra LeoneSlovak RepublicSloveniaSolomon IslandsSouth AfricaSpainSri LankaSurinameSwazilandSwedenSwitzerlandTajikistanTanzaniaThailandTimor-LesteTogoTrinidad and TobagoTunisiaTurkeyUgandaUkraineUnited Arab EmiratesUnited KingdomUnited StatesUruguayVanuatuVenezuela, RBWest Bank and GazaYemen, Rep.Zambia Timeline:
This timeline shows a graph from 2002 to 2012 of Suriname. No data until 2001. Number of actual observations by date: 11.
Source name:
World Development Indicators
Source organization:
International Monetary Fund, Government Finance Statistics Yearbook and data files.
Categories, topics:
Public Sector
Last updated:
apr 23, 2017
Indicators value changes by year
Minimum:
27.4 mln
jan 1, 2002
Maximum:
243.585 mln
jan 1, 2009
At the date of observation
Value
Absolute change
Change from previous value
jan 1, 2002
27.4 mln
+27.4 mln
0.0%
jan 1, 2003
29.998 mln
+2.598 mln
9.48%
jan 1, 2004
45.859 mln
+15.861 mln
52.87%
jan 1, 2005
58.167 mln
+12.308 mln
26.84%
jan 1, 2006
86.043 mln
+27.875 mln
47.92%
jan 1, 2007
159.73 mln
+73.687 mln
85.64%
jan 1, 2008
157.101 mln
-2.629 mln
-1.65%
jan 1, 2009
243.585 mln
+86.484 mln
55.05%
jan 1, 2010
214.77 mln
-28.815 mln
-11.83%
jan 1, 2011
149.149 mln
-65.621 mln
-30.55%
jan 1, 2012
115.375 mln
-33.774 mln
-22.64%
Ranking of countries by current statistics by years


Comments: