29
/
en
AIzaSyAYiBZKx7MnpbEhh9jyipgxe19OcubqV5w
April 1, 2024
205661
Namibia
NAM
true
2
1
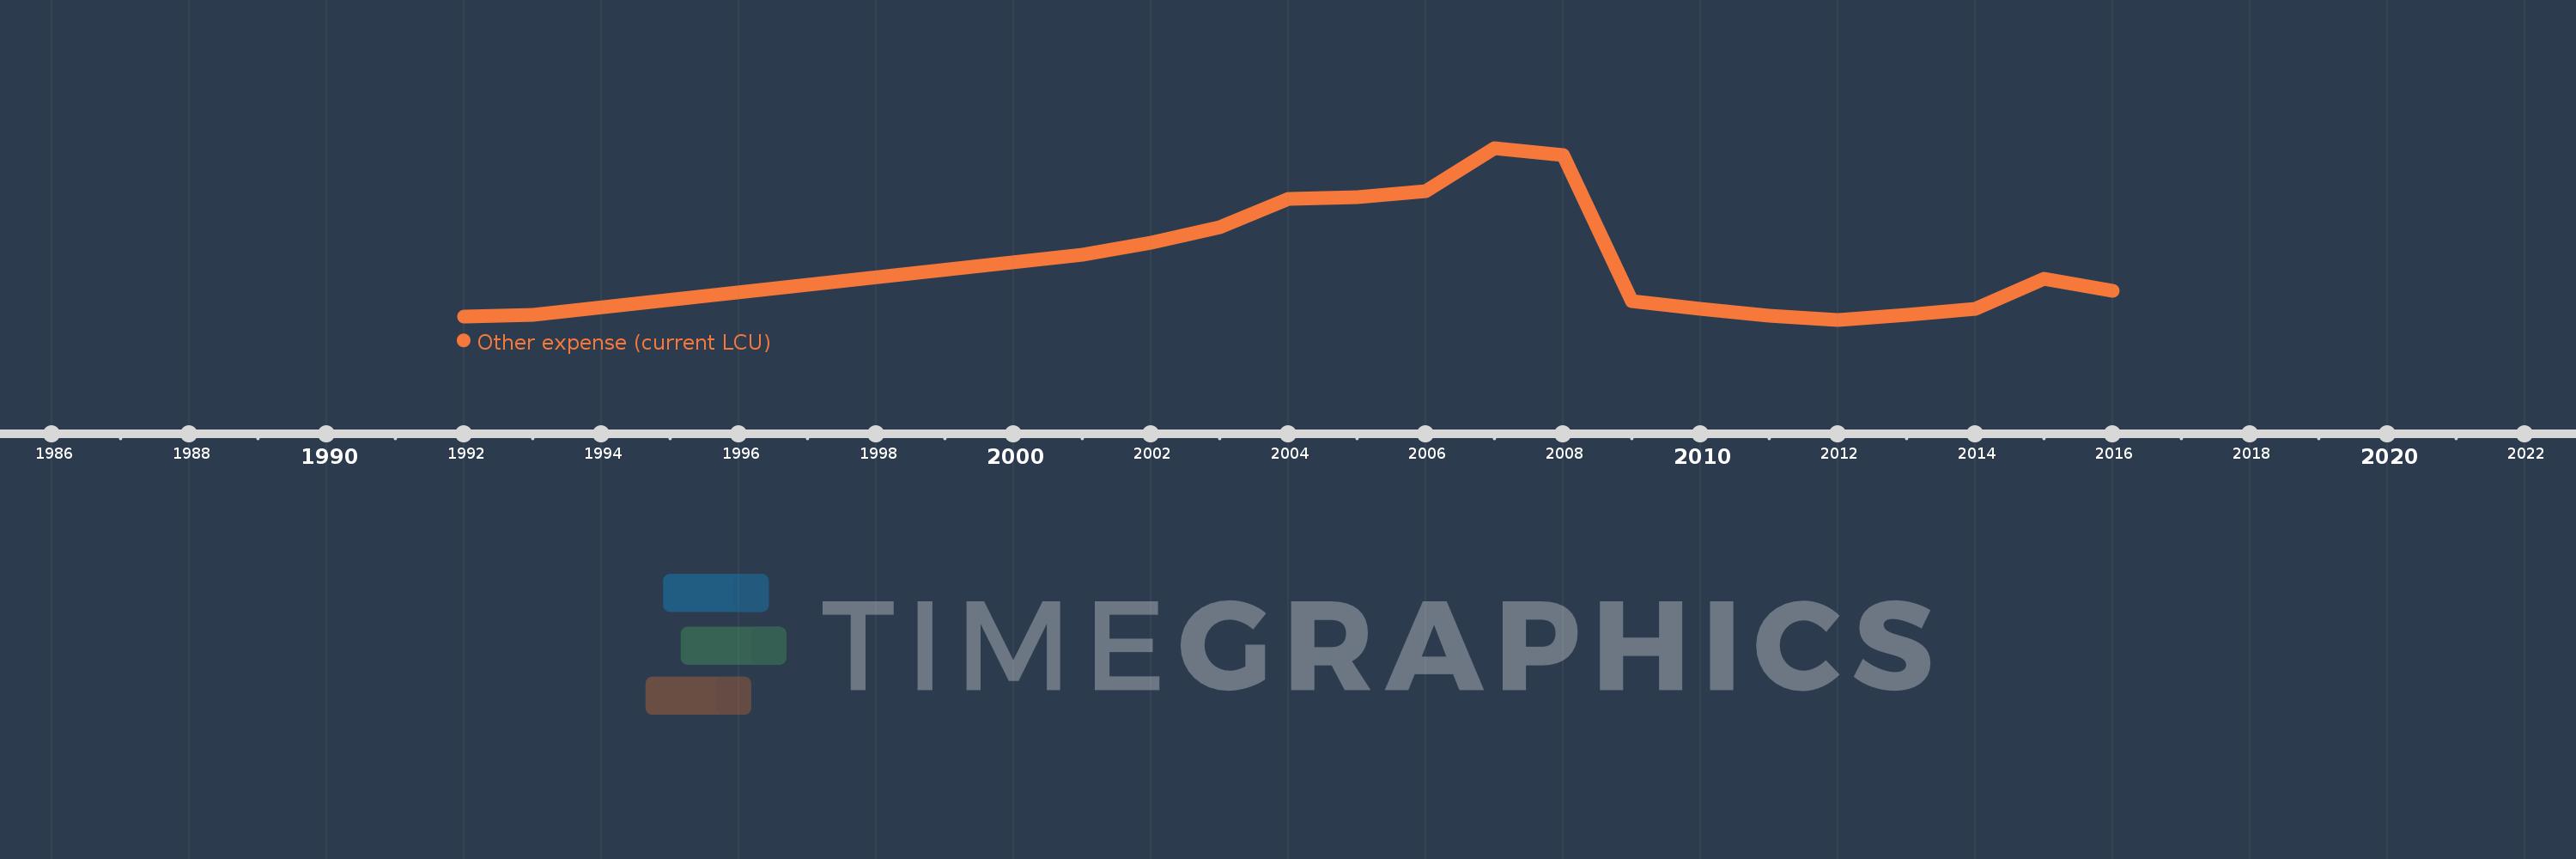
Other expense (current LCU)
2016,2015,2014,2013,2012,2011,2010,2009,2008,2007,2006,2005,2004,2003,2002,2001,1993,1992
This statistics in other country:
AfghanistanAlbaniaAlgeriaAngolaArmeniaAustraliaAustriaAzerbaijanBahrainBangladeshBarbadosBelarusBelgiumBelizeBeninBhutanBoliviaBosnia and HerzegovinaBotswanaBrazilBulgariaBurkina FasoBurundiCabo VerdeCambodiaCanadaCentral African RepublicChileColombiaCongo, Dem. Rep.Congo, Rep.Costa RicaCote d'IvoireCroatiaCyprusCzech RepublicDenmarkDominican RepublicEgypt, Arab Rep.El SalvadorEquatorial GuineaEstoniaEthiopiaFijiFinlandFranceGambia, TheGeorgiaGermanyGhanaGreeceGrenadaGuatemalaHondurasHong Kong SAR, ChinaHungaryIcelandIndiaIndonesiaIran, Islamic Rep.IraqIrelandIsraelItalyJamaicaJapanJordanKazakhstanKenyaKiribatiKorea, Rep.KuwaitKyrgyz RepublicLao PDRLatviaLebanonLesothoLithuaniaLuxembourgMacao SAR, ChinaMacedonia, FYRMadagascarMalawiMalaysiaMaldivesMaliMaltaMauritiusMicronesia, Fed. Sts.MoldovaMongoliaMoroccoMozambiqueNamibiaNepalNetherlandsNew ZealandNicaraguaNorwayOmanPakistanPanamaPapua New GuineaParaguayPeruPhilippinesPolandPortugalQatarRomaniaRussian FederationRwandaSamoaSan MarinoSao Tome and PrincipeSerbiaSeychellesSierra LeoneSlovak RepublicSloveniaSolomon IslandsSouth AfricaSpainSri LankaSurinameSwazilandSwedenSwitzerlandTajikistanTanzaniaThailandTimor-LesteTogoTrinidad and TobagoTunisiaTurkeyUgandaUkraineUnited Arab EmiratesUnited KingdomUnited StatesUruguayVanuatuVenezuela, RBWest Bank and GazaYemen, Rep.Zambia Timeline:
This timeline shows a graph from 1992 to 2016 of Namibia. No data until 1991. Number of actual observations by date: 18.
Source name:
World Development Indicators
Source organization:
International Monetary Fund, Government Finance Statistics Yearbook and data files.
Categories, topics:
Public Sector
Last updated:
apr 23, 2017
Indicators value changes by year
Minimum:
50.0 mln
jan 1, 2012
Maximum:
2.166 bln
jan 1, 2007
At the date of observation
Value
Absolute change
Change from previous value
jan 1, 1992
91.7 mln
+91.7 mln
0.0%
jan 1, 1993
109.3 mln
+17.6 mln
19.19%
jan 1, 2001
851.653 mln
+742.353 mln
679.19%
jan 1, 2002
1.001 bln
+149.045 mln
17.5%
jan 1, 2003
1.192 bln
+191.032 mln
19.09%
jan 1, 2004
1.542 bln
+350.125 mln
29.38%
jan 1, 2005
1.562 bln
+20.385 mln
1.32%
jan 1, 2006
1.63 bln
+68.015 mln
4.35%
jan 1, 2007
2.166 bln
+535.812 mln
32.87%
jan 1, 2008
2.073 bln
-92.592 mln
-4.27%
jan 1, 2009
282.837 mln
-1.791 bln
-86.36%
jan 1, 2010
184.354 mln
-98.483 mln
-34.82%
jan 1, 2011
98.194 mln
-86.16 mln
-46.74%
jan 1, 2012
50.0 mln
-48.194 mln
-49.08%
jan 1, 2013
114.514 mln
+64.514 mln
129.03%
jan 1, 2014
183.945 mln
+69.43 mln
60.63%
jan 1, 2015
558.975 mln
+375.03 mln
203.88%
jan 1, 2016
405.774 mln
-153.201 mln
-27.41%
Ranking of countries by current statistics by years


Comments: