29
/
en
AIzaSyAYiBZKx7MnpbEhh9jyipgxe19OcubqV5w
April 1, 2024
55189
Post-demographic dividend
PST
false
2
1
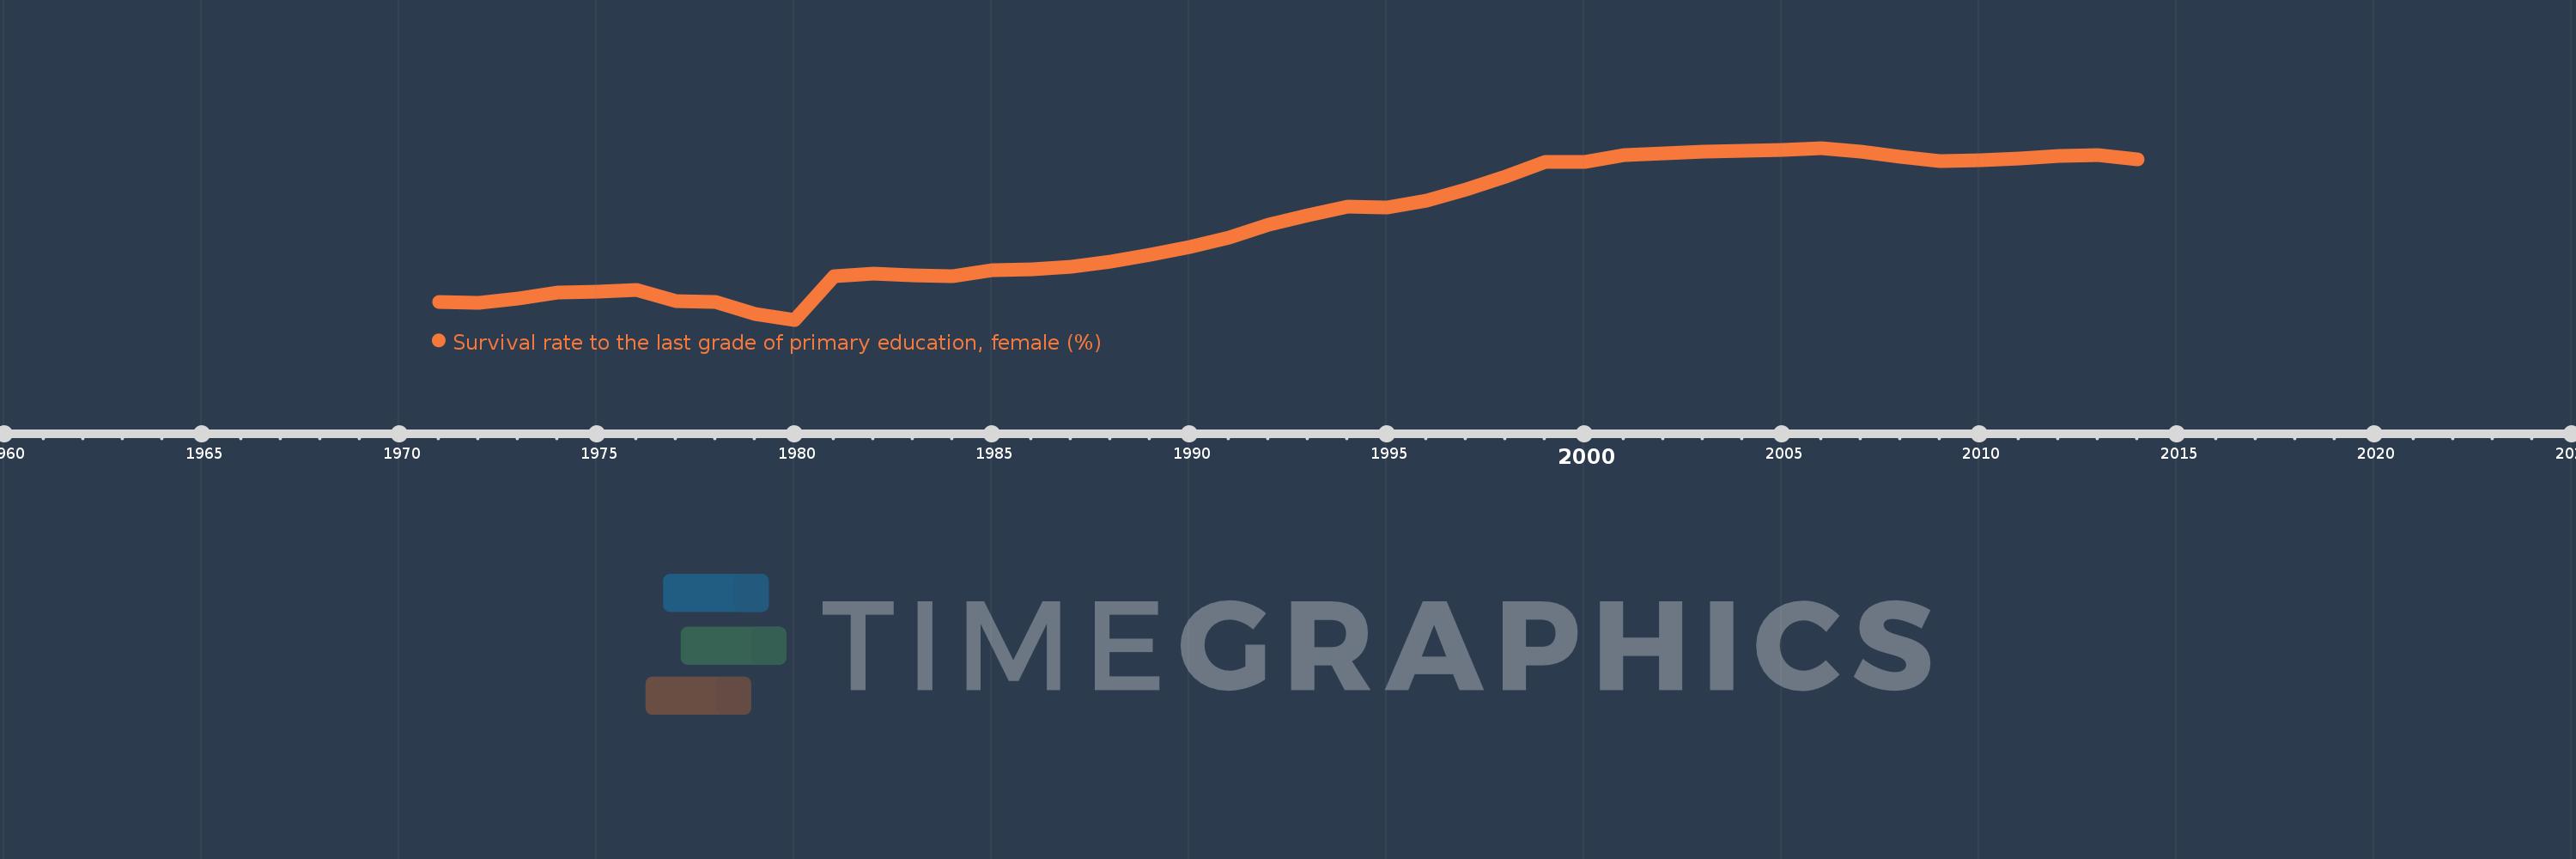
Survival rate to the last grade of primary education, female (%)
2014,2013,2012,2011,2010,2009,2008,2007,2006,2005,2004,2003,2002,2001,2000,1999,1998,1997,1996,1995,1994,1993,1992,1991,1990,1989,1988,1987,1986,1985,1984,1983,1982,1981,1980,1979,1978,1977,1976,1975,1974,1973,1972,1971
This statistics in other country:
AfghanistanAlbaniaAlgeriaAndorraAngolaArab WorldArgentinaArmeniaArubaAustriaAzerbaijanBahamas, TheBahrainBangladeshBarbadosBelarusBelgiumBelizeBeninBermudaBhutanBoliviaBosnia and HerzegovinaBotswanaBrazilBrunei DarussalamBulgariaBurkina FasoBurundiCabo VerdeCambodiaCameroonCanadaCaribbean small statesCentral African RepublicCentral Europe and the BalticsChadChileChinaColombiaComorosCongo, Dem. Rep.Congo, Rep.Costa RicaCote d'IvoireCroatiaCubaCyprusCzech RepublicDenmarkDjiboutiDominicaDominican RepublicEarly-demographic dividendEast Asia & PacificEast Asia & Pacific (excluding high income)East Asia & Pacific (IDA & IBRD countries)EcuadorEgypt, Arab Rep.El SalvadorEquatorial GuineaEritreaEstoniaEthiopiaEuro areaEurope & Central AsiaEurope & Central Asia (excluding high income)Europe & Central Asia (IDA & IBRD countries)European UnionFijiFinlandFragile and conflict affected situationsFranceGabonGambia, TheGeorgiaGermanyGhanaGreeceGuatemalaGuineaGuinea-BissauGuyanaHaitiHeavily indebted poor countries (HIPC)High incomeHondurasHong Kong SAR, ChinaHungaryIBRD onlyIcelandIDA & IBRD totalIDA blendIDA onlyIDA totalIndiaIndonesiaIran, Islamic Rep.IraqIsraelItalyJamaicaJapanJordanKazakhstanKenyaKiribatiKorea, Rep.KuwaitKyrgyz RepublicLao PDRLate-demographic dividendLatin America & Caribbean Latin America & Caribbean (excluding high income)Latin America & the Caribbean (IDA & IBRD countries)LatviaLeast developed countries: UN classificationLebanonLesothoLiberiaLibyaLiechtensteinLithuaniaLow & middle incomeLow incomeLower middle incomeLuxembourgMacao SAR, ChinaMacedonia, FYRMadagascarMalawiMalaysiaMaldivesMaliMaltaMarshall IslandsMauritaniaMauritiusMexicoMiddle East & North AfricaMiddle East & North Africa (excluding high income)Middle East & North Africa (IDA & IBRD countries)Middle incomeMoldovaMongoliaMontenegroMoroccoMozambiqueMyanmarNamibiaNepalNetherlandsNicaraguaNigerNigeriaNorth AmericaNorwayOECD membersOmanOther small statesPacific island small statesPakistanPanamaPapua New GuineaParaguayPeruPhilippinesPolandPortugalPost-demographic dividendPre-demographic dividendQatarRomaniaRussian FederationRwandaSamoaSan MarinoSao Tome and PrincipeSaudi ArabiaSenegalSerbiaSeychellesSierra LeoneSingaporeSlovak RepublicSloveniaSmall statesSolomon IslandsSouth AfricaSouth AsiaSouth Asia (IDA & IBRD)SpainSri LankaSt. Kitts and NevisSt. LuciaSt. Vincent and the GrenadinesSub-Saharan Africa Sub-Saharan Africa (excluding high income)Sub-Saharan Africa (IDA & IBRD countries)SudanSurinameSwazilandSwedenSwitzerlandSyrian Arab RepublicTajikistanTanzaniaThailandTimor-LesteTogoTongaTrinidad and TobagoTunisiaTurkeyUgandaUkraineUnited Arab EmiratesUpper middle incomeUruguayUzbekistanVanuatuVenezuela, RBVietnamWest Bank and GazaWorldYemen, Rep.ZambiaZimbabwe Timeline:
This timeline shows a graph from 1971 to 2014 of Post-demographic dividend. No data until 1970. Number of actual observations by date: 44.
Source name:
World Development Indicators
Source organization:
UNESCO Institute for Statistics
Categories, topics:
Education, Gender
Last updated:
apr 23, 2017
Indicators value changes by year
Minimum:
86.851
jan 1, 1980
Maximum:
95.518
jan 1, 2006
At the date of observation
Value
Absolute change
Change from previous value
jan 1, 1971
87.766
+87.766
0.0%
jan 1, 1972
87.716
-0.05
-0.06%
jan 1, 1973
87.941
+0.226
0.26%
jan 1, 1974
88.214
+0.273
0.31%
jan 1, 1975
88.27
+0.056
0.06%
jan 1, 1976
88.359
+0.089
0.1%
jan 1, 1977
87.775
-0.585
-0.66%
jan 1, 1978
87.731
-0.044
-0.05%
jan 1, 1979
87.147
-0.584
-0.67%
jan 1, 1980
86.851
-0.296
-0.34%
jan 1, 1981
89.047
+2.196
2.53%
jan 1, 1982
89.182
+0.135
0.15%
jan 1, 1983
89.085
-0.097
-0.11%
jan 1, 1984
89.044
-0.041
-0.05%
jan 1, 1985
89.334
+0.29
0.33%
jan 1, 1986
89.393
+0.059
0.07%
jan 1, 1987
89.539
+0.146
0.16%
jan 1, 1988
89.781
+0.242
0.27%
jan 1, 1989
90.124
+0.343
0.38%
jan 1, 1990
90.513
+0.389
0.43%
jan 1, 1991
90.993
+0.48
0.53%
jan 1, 1992
91.633
+0.64
0.7%
jan 1, 1993
92.142
+0.509
0.56%
jan 1, 1994
92.554
+0.412
0.45%
jan 1, 1995
92.522
-0.032
-0.03%
jan 1, 1996
92.875
+0.353
0.38%
jan 1, 1997
93.446
+0.571
0.61%
jan 1, 1998
94.063
+0.616
0.66%
jan 1, 1999
94.829
+0.767
0.82%
jan 1, 2000
94.803
-0.026
-0.03%
jan 1, 2001
95.167
+0.364
0.38%
jan 1, 2002
95.255
+0.088
0.09%
jan 1, 2003
95.344
+0.089
0.09%
jan 1, 2004
95.375
+0.031
0.03%
jan 1, 2005
95.408
+0.033
0.03%
jan 1, 2006
95.518
+0.11
0.11%
jan 1, 2007
95.324
-0.194
-0.2%
jan 1, 2008
95.081
-0.244
-0.26%
jan 1, 2009
94.857
-0.223
-0.24%
jan 1, 2010
94.9
+0.042
0.04%
jan 1, 2011
94.968
+0.068
0.07%
jan 1, 2012
95.1
+0.132
0.14%
jan 1, 2013
95.141
+0.041
0.04%
jan 1, 2014
94.929
-0.211
-0.22%
Ranking of countries by current statistics by years


Comments: