29
/
en
AIzaSyAYiBZKx7MnpbEhh9jyipgxe19OcubqV5w
April 1, 2024
43909
Latin America & the Caribbean (IDA & IBRD countries)
TLA
false
2
1
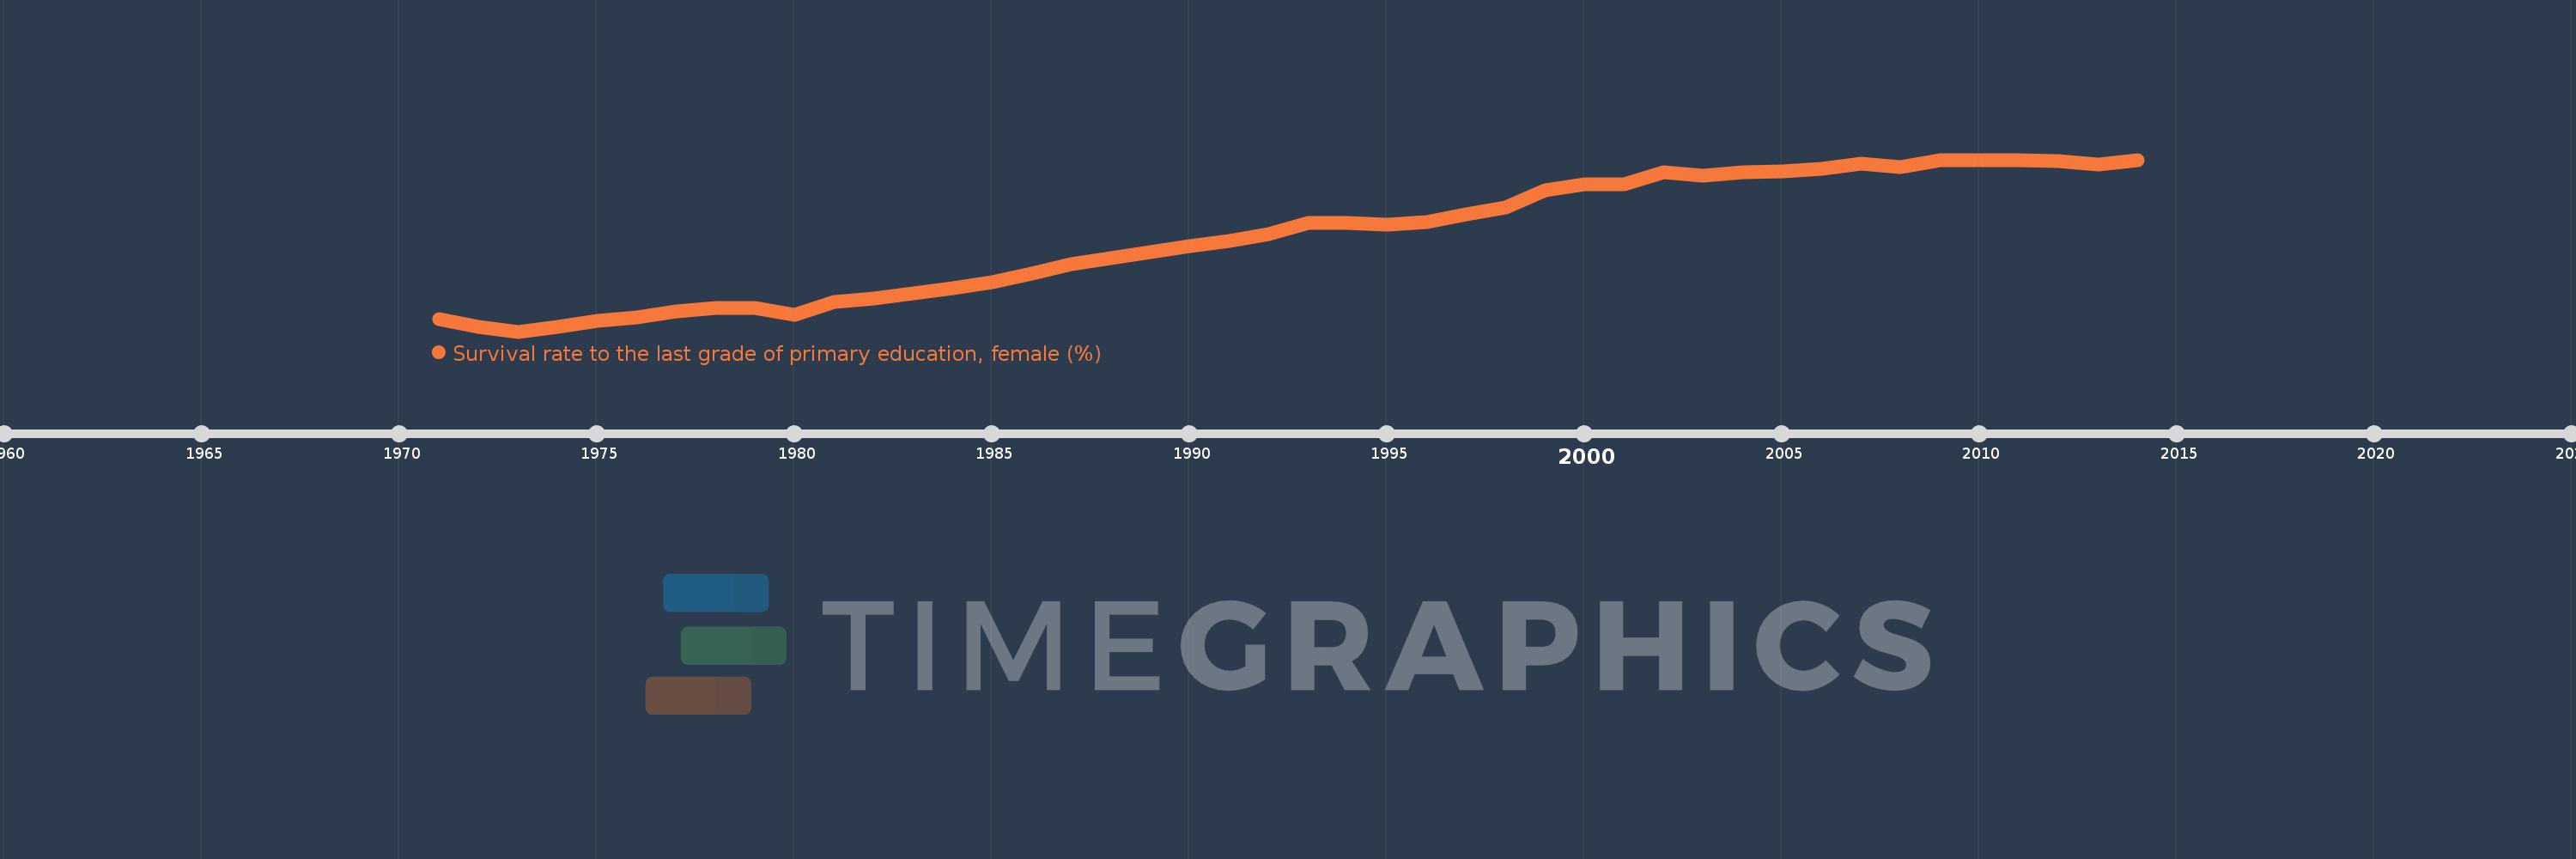
Survival rate to the last grade of primary education, female (%)
2014,2013,2012,2011,2010,2009,2008,2007,2006,2005,2004,2003,2002,2001,2000,1999,1998,1997,1996,1995,1994,1993,1992,1991,1990,1989,1988,1987,1986,1985,1984,1983,1982,1981,1980,1979,1978,1977,1976,1975,1974,1973,1972,1971
This statistics in other country:
AfghanistanAlbaniaAlgeriaAndorraAngolaArab WorldArgentinaArmeniaArubaAustriaAzerbaijanBahamas, TheBahrainBangladeshBarbadosBelarusBelgiumBelizeBeninBermudaBhutanBoliviaBosnia and HerzegovinaBotswanaBrazilBrunei DarussalamBulgariaBurkina FasoBurundiCabo VerdeCambodiaCameroonCanadaCaribbean small statesCentral African RepublicCentral Europe and the BalticsChadChileChinaColombiaComorosCongo, Dem. Rep.Congo, Rep.Costa RicaCote d'IvoireCroatiaCubaCyprusCzech RepublicDenmarkDjiboutiDominicaDominican RepublicEarly-demographic dividendEast Asia & PacificEast Asia & Pacific (excluding high income)East Asia & Pacific (IDA & IBRD countries)EcuadorEgypt, Arab Rep.El SalvadorEquatorial GuineaEritreaEstoniaEthiopiaEuro areaEurope & Central AsiaEurope & Central Asia (excluding high income)Europe & Central Asia (IDA & IBRD countries)European UnionFijiFinlandFragile and conflict affected situationsFranceGabonGambia, TheGeorgiaGermanyGhanaGreeceGuatemalaGuineaGuinea-BissauGuyanaHaitiHeavily indebted poor countries (HIPC)High incomeHondurasHong Kong SAR, ChinaHungaryIBRD onlyIcelandIDA & IBRD totalIDA blendIDA onlyIDA totalIndiaIndonesiaIran, Islamic Rep.IraqIsraelItalyJamaicaJapanJordanKazakhstanKenyaKiribatiKorea, Rep.KuwaitKyrgyz RepublicLao PDRLate-demographic dividendLatin America & Caribbean Latin America & Caribbean (excluding high income)Latin America & the Caribbean (IDA & IBRD countries)LatviaLeast developed countries: UN classificationLebanonLesothoLiberiaLibyaLiechtensteinLithuaniaLow & middle incomeLow incomeLower middle incomeLuxembourgMacao SAR, ChinaMacedonia, FYRMadagascarMalawiMalaysiaMaldivesMaliMaltaMarshall IslandsMauritaniaMauritiusMexicoMiddle East & North AfricaMiddle East & North Africa (excluding high income)Middle East & North Africa (IDA & IBRD countries)Middle incomeMoldovaMongoliaMontenegroMoroccoMozambiqueMyanmarNamibiaNepalNetherlandsNicaraguaNigerNigeriaNorth AmericaNorwayOECD membersOmanOther small statesPacific island small statesPakistanPanamaPapua New GuineaParaguayPeruPhilippinesPolandPortugalPost-demographic dividendPre-demographic dividendQatarRomaniaRussian FederationRwandaSamoaSan MarinoSao Tome and PrincipeSaudi ArabiaSenegalSerbiaSeychellesSierra LeoneSingaporeSlovak RepublicSloveniaSmall statesSolomon IslandsSouth AfricaSouth AsiaSouth Asia (IDA & IBRD)SpainSri LankaSt. Kitts and NevisSt. LuciaSt. Vincent and the GrenadinesSub-Saharan Africa Sub-Saharan Africa (excluding high income)Sub-Saharan Africa (IDA & IBRD countries)SudanSurinameSwazilandSwedenSwitzerlandSyrian Arab RepublicTajikistanTanzaniaThailandTimor-LesteTogoTongaTrinidad and TobagoTunisiaTurkeyUgandaUkraineUnited Arab EmiratesUpper middle incomeUruguayUzbekistanVanuatuVenezuela, RBVietnamWest Bank and GazaWorldYemen, Rep.ZambiaZimbabwe Timeline:
This timeline shows a graph from 1971 to 2014 of Latin America & the Caribbean (IDA & IBRD countries). No data until 1970. Number of actual observations by date: 44.
Source name:
World Development Indicators
Source organization:
UNESCO Institute for Statistics
Categories, topics:
Education, Gender
Last updated:
apr 23, 2017
Indicators value changes by year
Minimum:
41.213
jan 1, 1973
Maximum:
85.299
jan 1, 2014
At the date of observation
Value
Absolute change
Change from previous value
jan 1, 1971
44.455
+44.455
0.0%
jan 1, 1972
42.401
-2.053
-4.62%
jan 1, 1973
41.213
-1.188
-2.8%
jan 1, 1974
42.495
+1.282
3.11%
jan 1, 1975
43.993
+1.497
3.52%
jan 1, 1976
44.887
+0.894
2.03%
jan 1, 1977
46.489
+1.602
3.57%
jan 1, 1978
47.255
+0.767
1.65%
jan 1, 1979
47.351
+0.096
0.2%
jan 1, 1980
45.445
-1.906
-4.03%
jan 1, 1981
48.752
+3.308
7.28%
jan 1, 1982
49.785
+1.032
2.12%
jan 1, 1983
50.979
+1.194
2.4%
jan 1, 1984
52.286
+1.307
2.56%
jan 1, 1985
53.997
+1.711
3.27%
jan 1, 1986
56.025
+2.029
3.76%
jan 1, 1987
58.609
+2.584
4.61%
jan 1, 1988
59.963
+1.354
2.31%
jan 1, 1989
61.689
+1.726
2.88%
jan 1, 1990
63.126
+1.437
2.33%
jan 1, 1991
64.541
+1.415
2.24%
jan 1, 1992
66.284
+1.743
2.7%
jan 1, 1993
69.007
+2.723
4.11%
jan 1, 1994
69.015
+0.008
0.01%
jan 1, 1995
68.728
-0.287
-0.42%
jan 1, 1996
69.287
+0.558
0.81%
jan 1, 1997
71.207
+1.92
2.77%
jan 1, 1998
72.992
+1.785
2.51%
jan 1, 1999
77.465
+4.474
6.13%
jan 1, 2000
78.969
+1.504
1.94%
jan 1, 2001
79.1
+0.131
0.17%
jan 1, 2002
82.013
+2.912
3.68%
jan 1, 2003
81.261
-0.751
-0.92%
jan 1, 2004
81.995
+0.734
0.9%
jan 1, 2005
82.349
+0.354
0.43%
jan 1, 2006
82.979
+0.629
0.76%
jan 1, 2007
84.262
+1.284
1.55%
jan 1, 2008
83.423
-0.84
-1.0%
jan 1, 2009
85.125
+1.703
2.04%
jan 1, 2010
85.244
+0.118
0.14%
jan 1, 2011
85.222
-0.022
-0.03%
jan 1, 2012
84.955
-0.267
-0.31%
jan 1, 2013
84.036
-0.919
-1.08%
jan 1, 2014
85.299
+1.263
1.5%
Ranking of countries by current statistics by years


Comments: