29
/
en
AIzaSyAYiBZKx7MnpbEhh9jyipgxe19OcubqV5w
April 1, 2024
25344
Caribbean small states
CSS
false
2
1
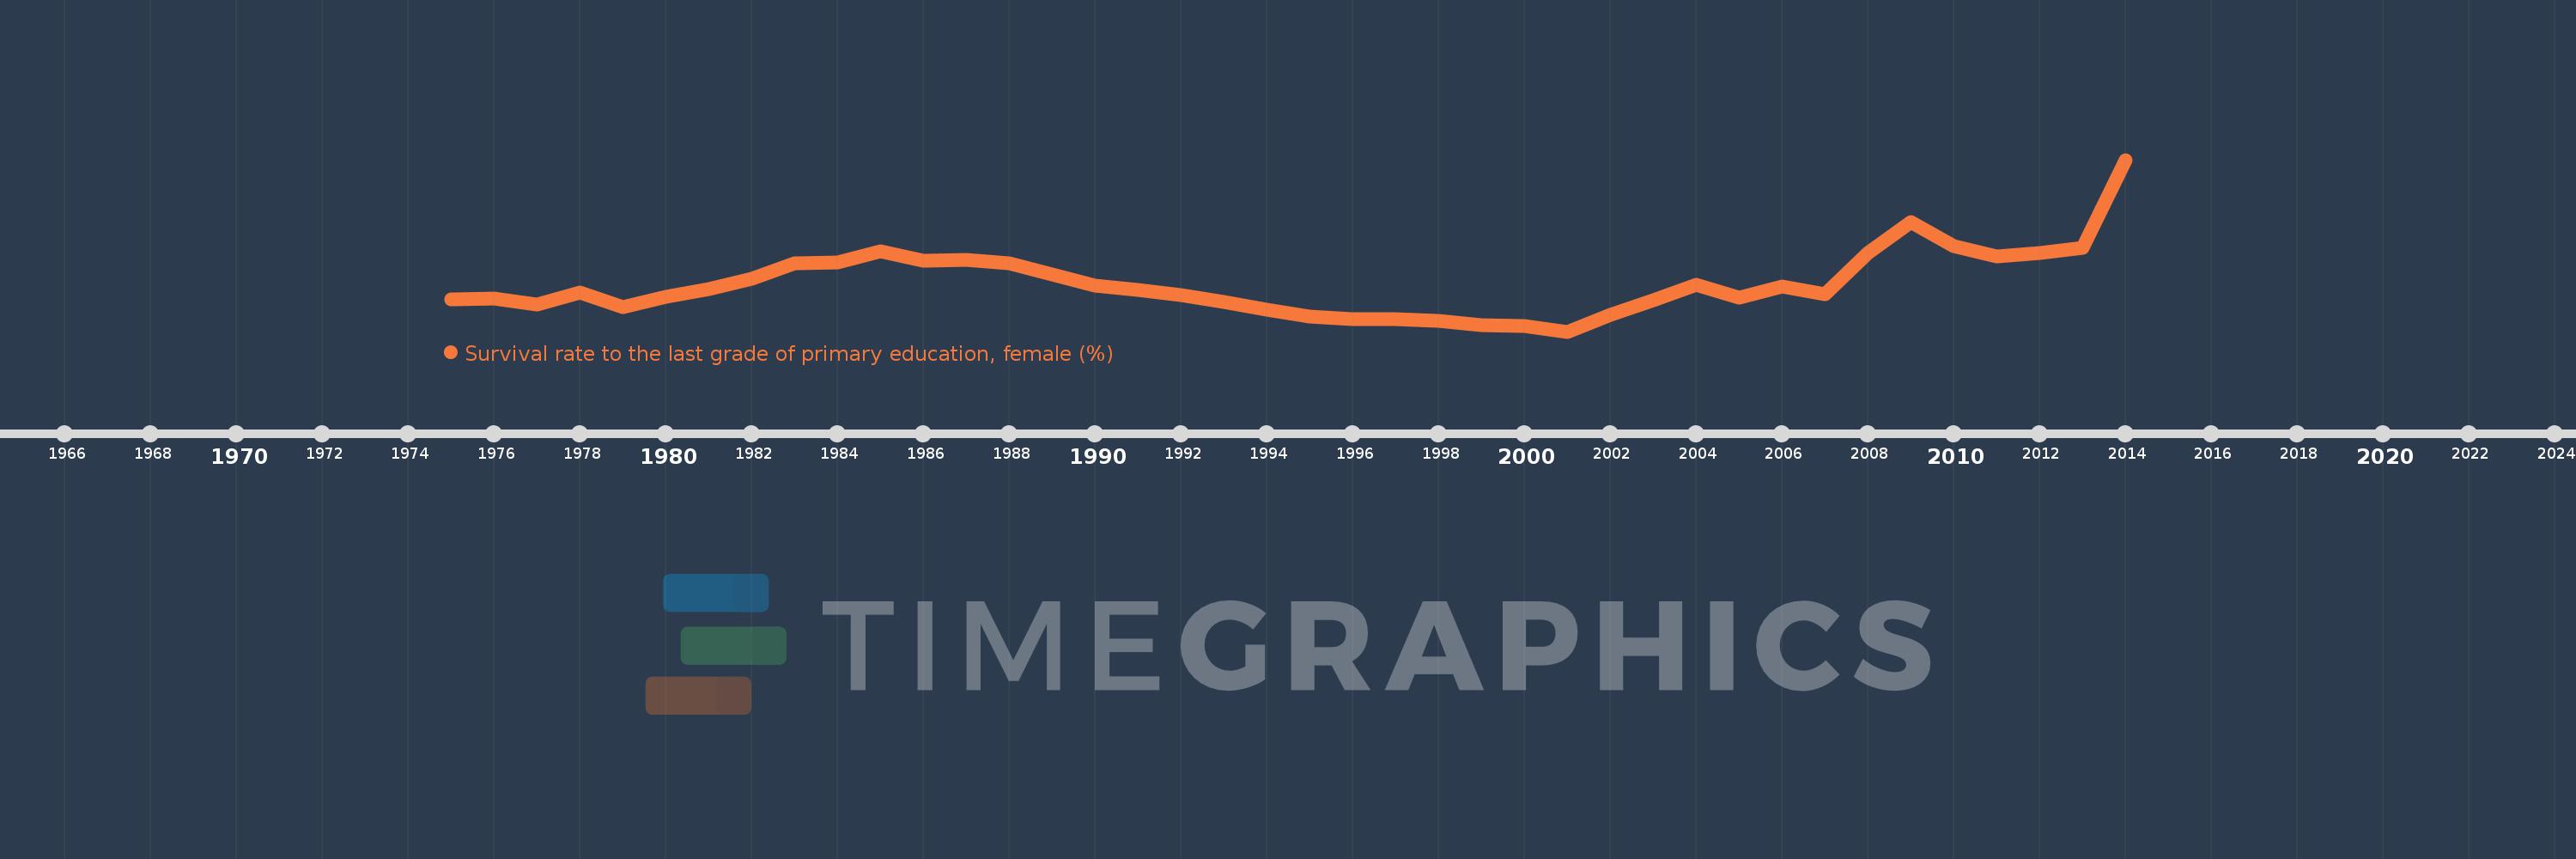
Survival rate to the last grade of primary education, female (%)
2014,2013,2012,2011,2010,2009,2008,2007,2006,2005,2004,2003,2002,2001,2000,1999,1998,1997,1996,1995,1994,1993,1992,1991,1990,1989,1988,1987,1986,1985,1984,1983,1982,1981,1980,1979,1978,1977,1976,1975
This statistics in other country:
AfghanistanAlbaniaAlgeriaAndorraAngolaArab WorldArgentinaArmeniaArubaAustriaAzerbaijanBahamas, TheBahrainBangladeshBarbadosBelarusBelgiumBelizeBeninBermudaBhutanBoliviaBosnia and HerzegovinaBotswanaBrazilBrunei DarussalamBulgariaBurkina FasoBurundiCabo VerdeCambodiaCameroonCanadaCaribbean small statesCentral African RepublicCentral Europe and the BalticsChadChileChinaColombiaComorosCongo, Dem. Rep.Congo, Rep.Costa RicaCote d'IvoireCroatiaCubaCyprusCzech RepublicDenmarkDjiboutiDominicaDominican RepublicEarly-demographic dividendEast Asia & PacificEast Asia & Pacific (excluding high income)East Asia & Pacific (IDA & IBRD countries)EcuadorEgypt, Arab Rep.El SalvadorEquatorial GuineaEritreaEstoniaEthiopiaEuro areaEurope & Central AsiaEurope & Central Asia (excluding high income)Europe & Central Asia (IDA & IBRD countries)European UnionFijiFinlandFragile and conflict affected situationsFranceGabonGambia, TheGeorgiaGermanyGhanaGreeceGuatemalaGuineaGuinea-BissauGuyanaHaitiHeavily indebted poor countries (HIPC)High incomeHondurasHong Kong SAR, ChinaHungaryIBRD onlyIcelandIDA & IBRD totalIDA blendIDA onlyIDA totalIndiaIndonesiaIran, Islamic Rep.IraqIsraelItalyJamaicaJapanJordanKazakhstanKenyaKiribatiKorea, Rep.KuwaitKyrgyz RepublicLao PDRLate-demographic dividendLatin America & Caribbean Latin America & Caribbean (excluding high income)Latin America & the Caribbean (IDA & IBRD countries)LatviaLeast developed countries: UN classificationLebanonLesothoLiberiaLibyaLiechtensteinLithuaniaLow & middle incomeLow incomeLower middle incomeLuxembourgMacao SAR, ChinaMacedonia, FYRMadagascarMalawiMalaysiaMaldivesMaliMaltaMarshall IslandsMauritaniaMauritiusMexicoMiddle East & North AfricaMiddle East & North Africa (excluding high income)Middle East & North Africa (IDA & IBRD countries)Middle incomeMoldovaMongoliaMontenegroMoroccoMozambiqueMyanmarNamibiaNepalNetherlandsNicaraguaNigerNigeriaNorth AmericaNorwayOECD membersOmanOther small statesPacific island small statesPakistanPanamaPapua New GuineaParaguayPeruPhilippinesPolandPortugalPost-demographic dividendPre-demographic dividendQatarRomaniaRussian FederationRwandaSamoaSan MarinoSao Tome and PrincipeSaudi ArabiaSenegalSerbiaSeychellesSierra LeoneSingaporeSlovak RepublicSloveniaSmall statesSolomon IslandsSouth AfricaSouth AsiaSouth Asia (IDA & IBRD)SpainSri LankaSt. Kitts and NevisSt. LuciaSt. Vincent and the GrenadinesSub-Saharan Africa Sub-Saharan Africa (excluding high income)Sub-Saharan Africa (IDA & IBRD countries)SudanSurinameSwazilandSwedenSwitzerlandSyrian Arab RepublicTajikistanTanzaniaThailandTimor-LesteTogoTongaTrinidad and TobagoTunisiaTurkeyUgandaUkraineUnited Arab EmiratesUpper middle incomeUruguayUzbekistanVanuatuVenezuela, RBVietnamWest Bank and GazaWorldYemen, Rep.ZambiaZimbabwe Timeline:
This timeline shows a graph from 1975 to 2014 of Caribbean small states. No data until 1974. Number of actual observations by date: 40.
Source name:
World Development Indicators
Source organization:
UNESCO Institute for Statistics
Categories, topics:
Education, Gender
Last updated:
apr 23, 2017
Indicators value changes by year
Minimum:
84.257
jan 1, 2001
Maximum:
93.647
jan 1, 2014
At the date of observation
Value
Absolute change
Change from previous value
jan 1, 1975
86.015
+86.015
0.0%
jan 1, 1976
86.084
+0.069
0.08%
jan 1, 1977
85.745
-0.34
-0.39%
jan 1, 1978
86.402
+0.658
0.77%
jan 1, 1979
85.58
-0.822
-0.95%
jan 1, 1980
86.162
+0.581
0.68%
jan 1, 1981
86.594
+0.432
0.5%
jan 1, 1982
87.141
+0.548
0.63%
jan 1, 1983
87.985
+0.844
0.97%
jan 1, 1984
88.021
+0.035
0.04%
jan 1, 1985
88.637
+0.616
0.7%
jan 1, 1986
88.14
-0.496
-0.56%
jan 1, 1987
88.169
+0.029
0.03%
jan 1, 1988
87.989
-0.18
-0.2%
jan 1, 1989
87.366
-0.622
-0.71%
jan 1, 1990
86.748
-0.618
-0.71%
jan 1, 1991
86.549
-0.199
-0.23%
jan 1, 1992
86.251
-0.298
-0.34%
jan 1, 1993
85.863
-0.388
-0.45%
jan 1, 1994
85.433
-0.43
-0.5%
jan 1, 1995
85.077
-0.356
-0.42%
jan 1, 1996
84.923
-0.155
-0.18%
jan 1, 1997
84.928
+0.006
0.01%
jan 1, 1998
84.833
-0.095
-0.11%
jan 1, 1999
84.631
-0.202
-0.24%
jan 1, 2000
84.543
-0.088
-0.1%
jan 1, 2001
84.257
-0.286
-0.34%
jan 1, 2002
85.189
+0.932
1.11%
jan 1, 2003
85.979
+0.79
0.93%
jan 1, 2004
86.808
+0.829
0.96%
jan 1, 2005
86.12
-0.688
-0.79%
jan 1, 2006
86.706
+0.586
0.68%
jan 1, 2007
86.309
-0.397
-0.46%
jan 1, 2008
88.575
+2.267
2.63%
jan 1, 2009
90.226
+1.651
1.86%
jan 1, 2010
88.925
-1.301
-1.44%
jan 1, 2011
88.369
-0.556
-0.63%
jan 1, 2012
88.574
+0.205
0.23%
jan 1, 2013
88.821
+0.247
0.28%
jan 1, 2014
93.647
+4.826
5.43%
Ranking of countries by current statistics by years


Comments: