29
/
en
AIzaSyAYiBZKx7MnpbEhh9jyipgxe19OcubqV5w
April 1, 2024
37028
IBRD only
IBD
false
2
1
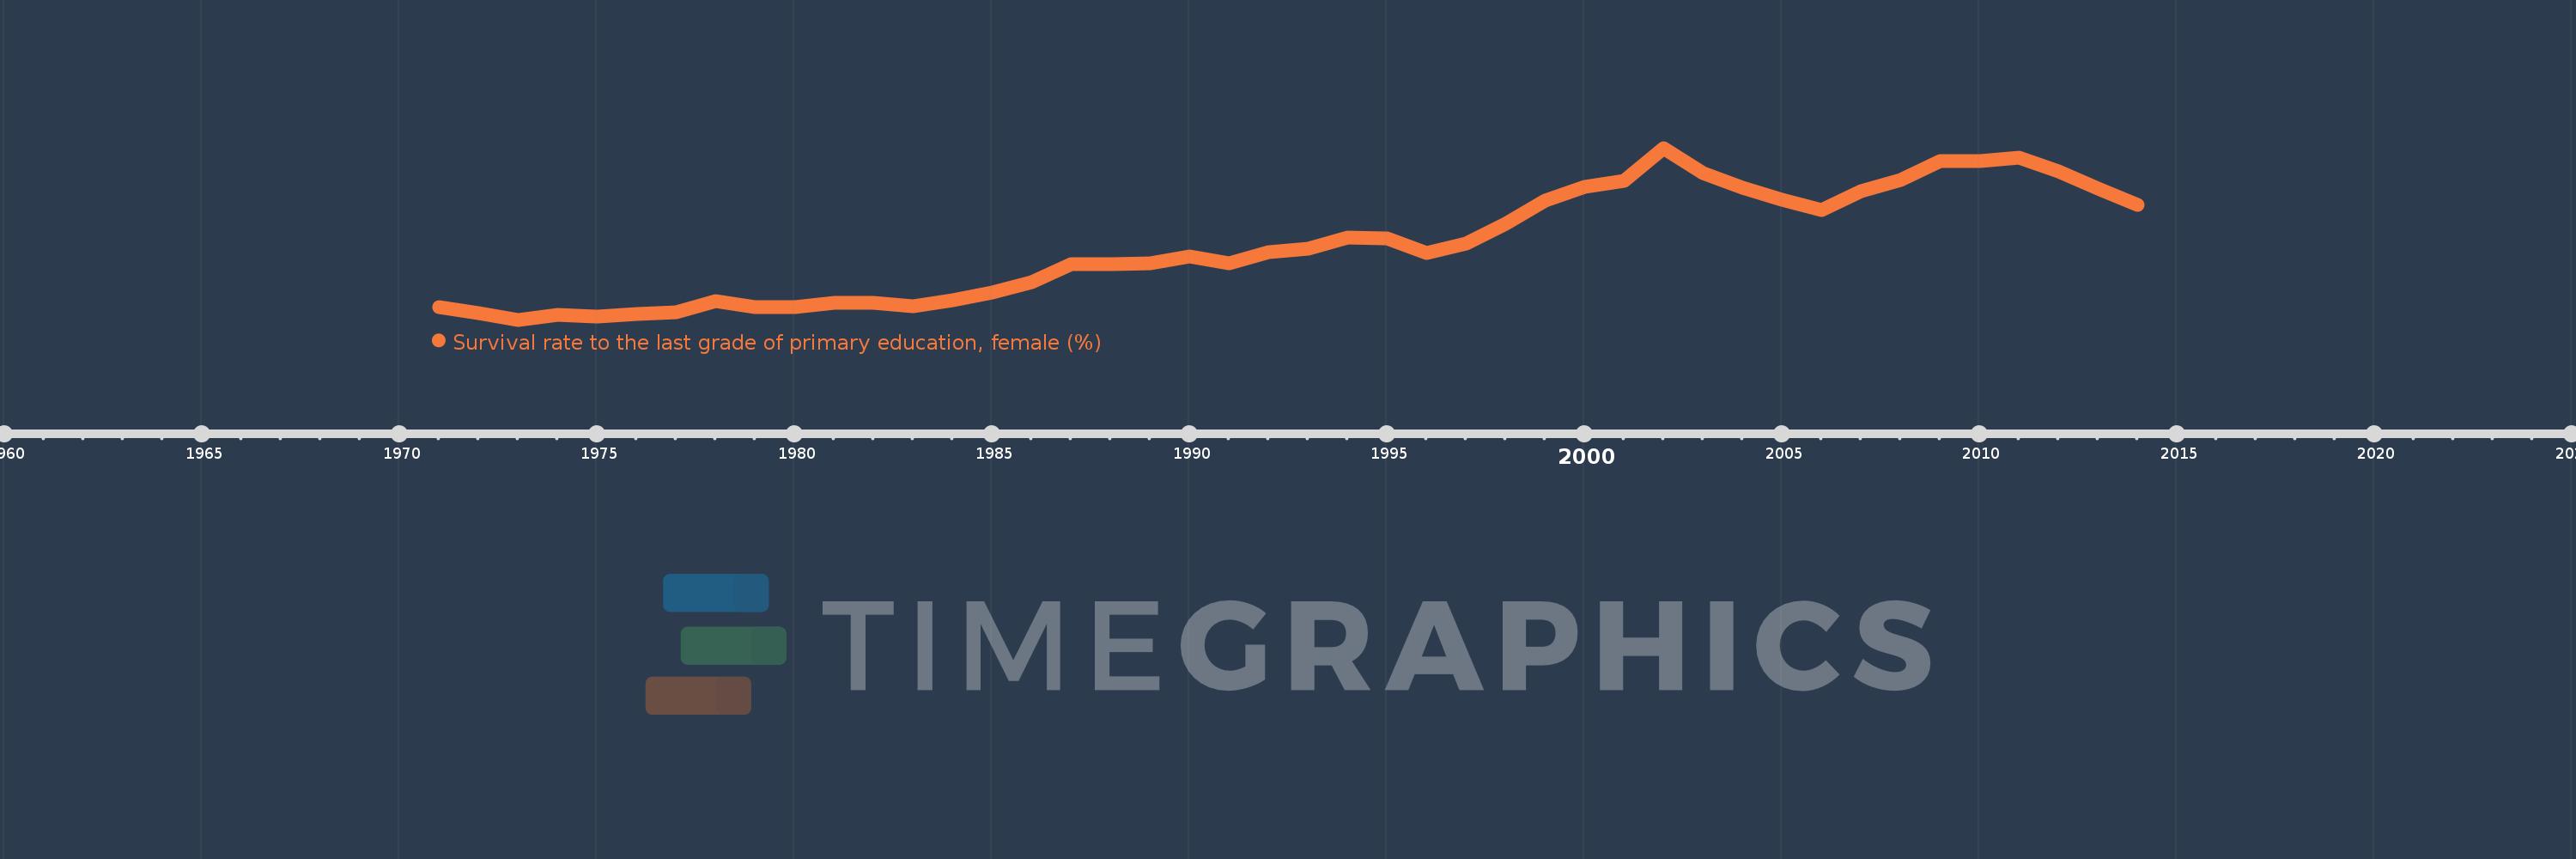
Survival rate to the last grade of primary education, female (%)
2014,2013,2012,2011,2010,2009,2008,2007,2006,2005,2004,2003,2002,2001,2000,1999,1998,1997,1996,1995,1994,1993,1992,1991,1990,1989,1988,1987,1986,1985,1984,1983,1982,1981,1980,1979,1978,1977,1976,1975,1974,1973,1972,1971
This statistics in other country:
AfghanistanAlbaniaAlgeriaAndorraAngolaArab WorldArgentinaArmeniaArubaAustriaAzerbaijanBahamas, TheBahrainBangladeshBarbadosBelarusBelgiumBelizeBeninBermudaBhutanBoliviaBosnia and HerzegovinaBotswanaBrazilBrunei DarussalamBulgariaBurkina FasoBurundiCabo VerdeCambodiaCameroonCanadaCaribbean small statesCentral African RepublicCentral Europe and the BalticsChadChileChinaColombiaComorosCongo, Dem. Rep.Congo, Rep.Costa RicaCote d'IvoireCroatiaCubaCyprusCzech RepublicDenmarkDjiboutiDominicaDominican RepublicEarly-demographic dividendEast Asia & PacificEast Asia & Pacific (excluding high income)East Asia & Pacific (IDA & IBRD countries)EcuadorEgypt, Arab Rep.El SalvadorEquatorial GuineaEritreaEstoniaEthiopiaEuro areaEurope & Central AsiaEurope & Central Asia (excluding high income)Europe & Central Asia (IDA & IBRD countries)European UnionFijiFinlandFragile and conflict affected situationsFranceGabonGambia, TheGeorgiaGermanyGhanaGreeceGuatemalaGuineaGuinea-BissauGuyanaHaitiHeavily indebted poor countries (HIPC)High incomeHondurasHong Kong SAR, ChinaHungaryIBRD onlyIcelandIDA & IBRD totalIDA blendIDA onlyIDA totalIndiaIndonesiaIran, Islamic Rep.IraqIsraelItalyJamaicaJapanJordanKazakhstanKenyaKiribatiKorea, Rep.KuwaitKyrgyz RepublicLao PDRLate-demographic dividendLatin America & Caribbean Latin America & Caribbean (excluding high income)Latin America & the Caribbean (IDA & IBRD countries)LatviaLeast developed countries: UN classificationLebanonLesothoLiberiaLibyaLiechtensteinLithuaniaLow & middle incomeLow incomeLower middle incomeLuxembourgMacao SAR, ChinaMacedonia, FYRMadagascarMalawiMalaysiaMaldivesMaliMaltaMarshall IslandsMauritaniaMauritiusMexicoMiddle East & North AfricaMiddle East & North Africa (excluding high income)Middle East & North Africa (IDA & IBRD countries)Middle incomeMoldovaMongoliaMontenegroMoroccoMozambiqueMyanmarNamibiaNepalNetherlandsNicaraguaNigerNigeriaNorth AmericaNorwayOECD membersOmanOther small statesPacific island small statesPakistanPanamaPapua New GuineaParaguayPeruPhilippinesPolandPortugalPost-demographic dividendPre-demographic dividendQatarRomaniaRussian FederationRwandaSamoaSan MarinoSao Tome and PrincipeSaudi ArabiaSenegalSerbiaSeychellesSierra LeoneSingaporeSlovak RepublicSloveniaSmall statesSolomon IslandsSouth AfricaSouth AsiaSouth Asia (IDA & IBRD)SpainSri LankaSt. Kitts and NevisSt. LuciaSt. Vincent and the GrenadinesSub-Saharan Africa Sub-Saharan Africa (excluding high income)Sub-Saharan Africa (IDA & IBRD countries)SudanSurinameSwazilandSwedenSwitzerlandSyrian Arab RepublicTajikistanTanzaniaThailandTimor-LesteTogoTongaTrinidad and TobagoTunisiaTurkeyUgandaUkraineUnited Arab EmiratesUpper middle incomeUruguayUzbekistanVanuatuVenezuela, RBVietnamWest Bank and GazaWorldYemen, Rep.ZambiaZimbabwe Timeline:
This timeline shows a graph from 1971 to 2014 of IBRD only. No data until 1970. Number of actual observations by date: 44.
Source name:
World Development Indicators
Source organization:
UNESCO Institute for Statistics
Categories, topics:
Education, Gender
Last updated:
apr 23, 2017
Indicators value changes by year
Minimum:
64.172
jan 1, 1973
Maximum:
80.916
jan 1, 2002
At the date of observation
Value
Absolute change
Change from previous value
jan 1, 1971
65.404
+65.404
0.0%
jan 1, 1972
64.786
-0.618
-0.94%
jan 1, 1973
64.172
-0.615
-0.95%
jan 1, 1974
64.621
+0.449
0.7%
jan 1, 1975
64.499
-0.123
-0.19%
jan 1, 1976
64.77
+0.272
0.42%
jan 1, 1977
64.936
+0.166
0.26%
jan 1, 1978
66.026
+1.09
1.68%
jan 1, 1979
65.401
-0.625
-0.95%
jan 1, 1980
65.401
+0.0
0.0%
jan 1, 1981
65.855
+0.453
0.69%
jan 1, 1982
65.83
-0.025
-0.04%
jan 1, 1983
65.524
-0.306
-0.47%
jan 1, 1984
66.043
+0.52
0.79%
jan 1, 1985
66.829
+0.786
1.19%
jan 1, 1986
67.867
+1.038
1.55%
jan 1, 1987
69.567
+1.7
2.5%
jan 1, 1988
69.592
+0.026
0.04%
jan 1, 1989
69.693
+0.1
0.14%
jan 1, 1990
70.303
+0.61
0.87%
jan 1, 1991
69.647
-0.655
-0.93%
jan 1, 1992
70.732
+1.085
1.56%
jan 1, 1993
71.135
+0.402
0.57%
jan 1, 1994
72.201
+1.066
1.5%
jan 1, 1995
72.111
-0.09
-0.12%
jan 1, 1996
70.671
-1.44
-2.0%
jan 1, 1997
71.576
+0.905
1.28%
jan 1, 1998
73.514
+1.938
2.71%
jan 1, 1999
75.772
+2.258
3.07%
jan 1, 2000
77.146
+1.374
1.81%
jan 1, 2001
77.735
+0.59
0.76%
jan 1, 2002
80.916
+3.181
4.09%
jan 1, 2003
78.498
-2.418
-2.99%
jan 1, 2004
77.041
-1.457
-1.86%
jan 1, 2005
75.839
-1.202
-1.56%
jan 1, 2006
74.862
-0.978
-1.29%
jan 1, 2007
76.691
+1.829
2.44%
jan 1, 2008
77.834
+1.143
1.49%
jan 1, 2009
79.648
+1.814
2.33%
jan 1, 2010
79.651
+0.003
0.0%
jan 1, 2011
79.949
+0.298
0.37%
jan 1, 2012
78.65
-1.299
-1.62%
jan 1, 2013
76.977
-1.673
-2.13%
jan 1, 2014
75.398
-1.579
-2.05%
Ranking of countries by current statistics by years


Comments: