29
/
en
AIzaSyAYiBZKx7MnpbEhh9jyipgxe19OcubqV5w
April 1, 2024
84806
Benin
BEN
true
2
1
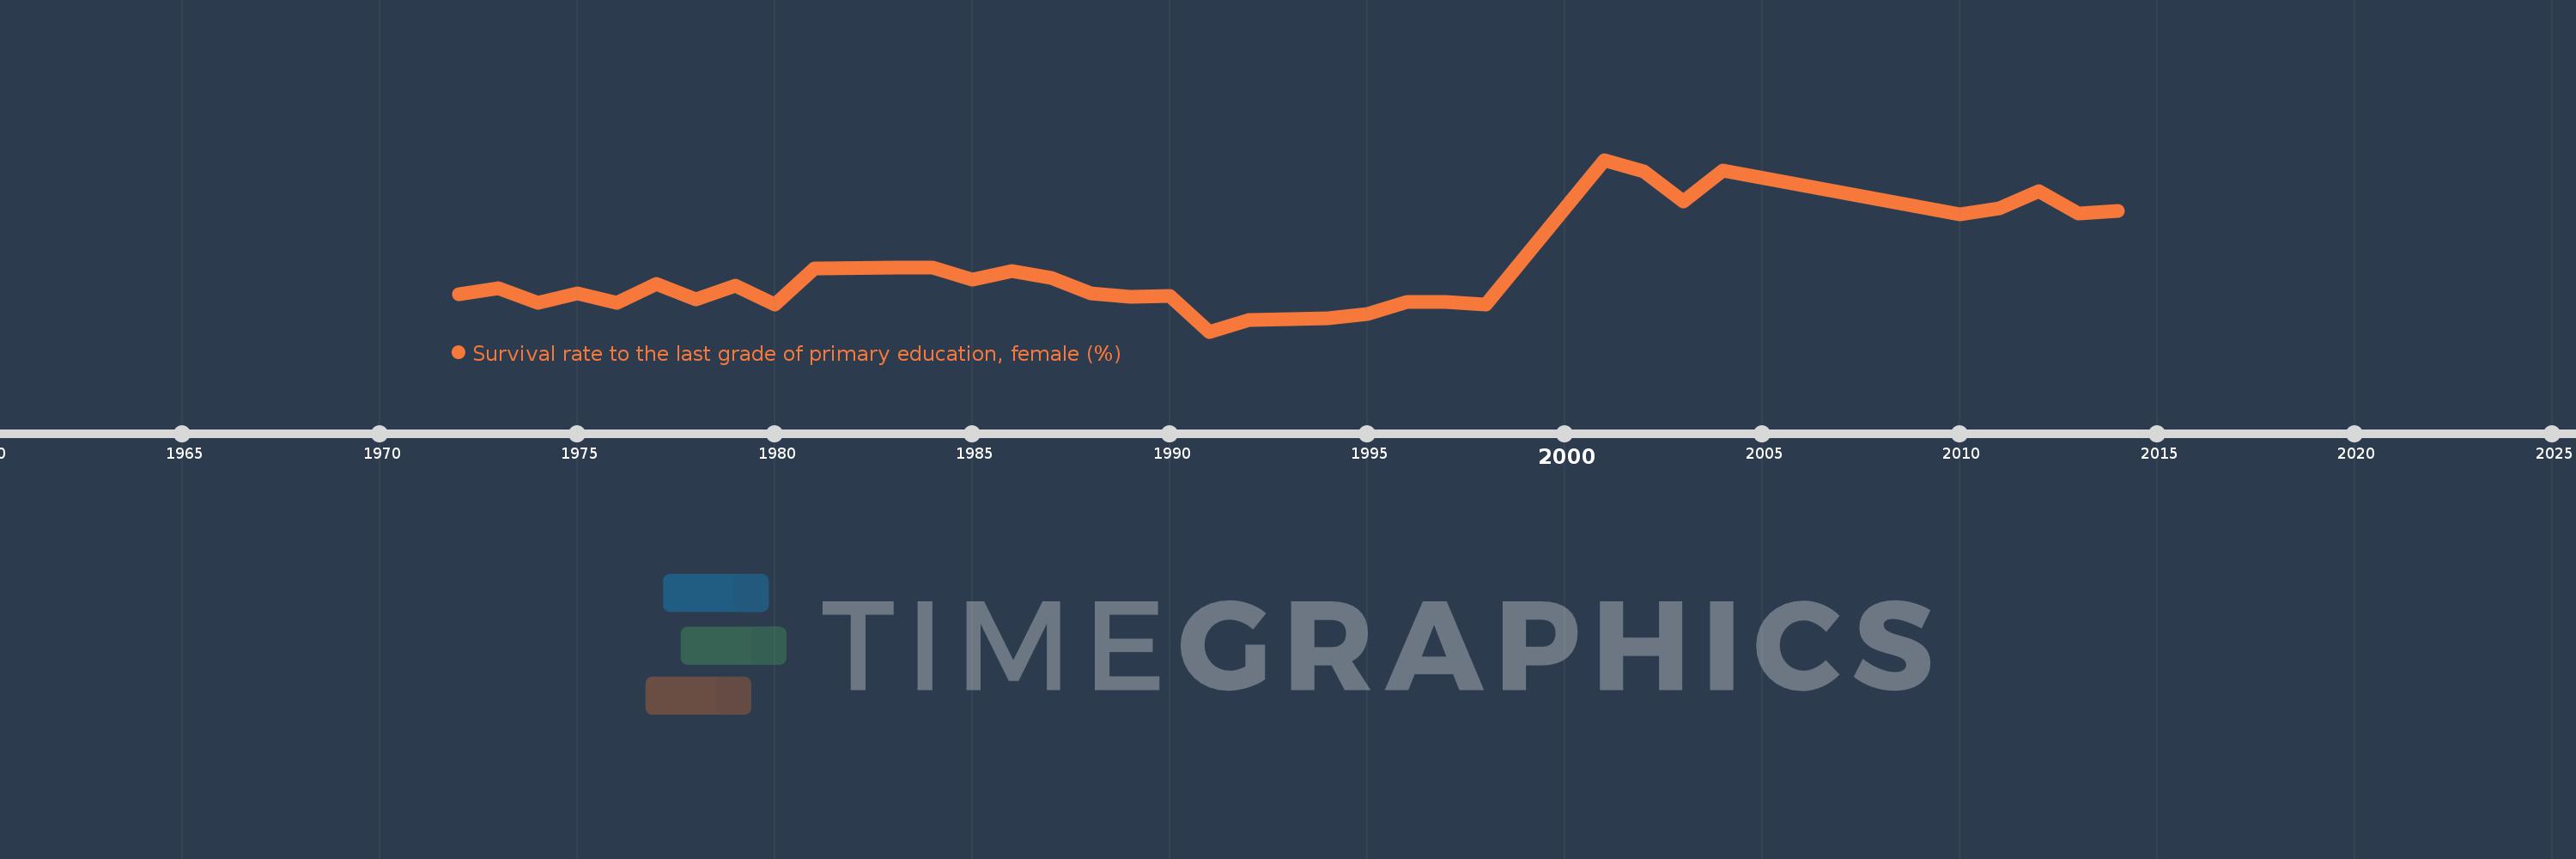
Survival rate to the last grade of primary education, female (%)
2014,2013,2012,2011,2010,2004,2003,2002,2001,1998,1997,1996,1995,1994,1993,1992,1991,1990,1989,1988,1987,1986,1985,1984,1983,1981,1980,1979,1978,1977,1976,1975,1974,1973,1972
This statistics in other country:
AfghanistanAlbaniaAlgeriaAndorraAngolaArab WorldArgentinaArmeniaArubaAustriaAzerbaijanBahamas, TheBahrainBangladeshBarbadosBelarusBelgiumBelizeBeninBermudaBhutanBoliviaBosnia and HerzegovinaBotswanaBrazilBrunei DarussalamBulgariaBurkina FasoBurundiCabo VerdeCambodiaCameroonCanadaCaribbean small statesCentral African RepublicCentral Europe and the BalticsChadChileChinaColombiaComorosCongo, Dem. Rep.Congo, Rep.Costa RicaCote d'IvoireCroatiaCubaCyprusCzech RepublicDenmarkDjiboutiDominicaDominican RepublicEarly-demographic dividendEast Asia & PacificEast Asia & Pacific (excluding high income)East Asia & Pacific (IDA & IBRD countries)EcuadorEgypt, Arab Rep.El SalvadorEquatorial GuineaEritreaEstoniaEthiopiaEuro areaEurope & Central AsiaEurope & Central Asia (excluding high income)Europe & Central Asia (IDA & IBRD countries)European UnionFijiFinlandFragile and conflict affected situationsFranceGabonGambia, TheGeorgiaGermanyGhanaGreeceGuatemalaGuineaGuinea-BissauGuyanaHaitiHeavily indebted poor countries (HIPC)High incomeHondurasHong Kong SAR, ChinaHungaryIBRD onlyIcelandIDA & IBRD totalIDA blendIDA onlyIDA totalIndiaIndonesiaIran, Islamic Rep.IraqIsraelItalyJamaicaJapanJordanKazakhstanKenyaKiribatiKorea, Rep.KuwaitKyrgyz RepublicLao PDRLate-demographic dividendLatin America & Caribbean Latin America & Caribbean (excluding high income)Latin America & the Caribbean (IDA & IBRD countries)LatviaLeast developed countries: UN classificationLebanonLesothoLiberiaLibyaLiechtensteinLithuaniaLow & middle incomeLow incomeLower middle incomeLuxembourgMacao SAR, ChinaMacedonia, FYRMadagascarMalawiMalaysiaMaldivesMaliMaltaMarshall IslandsMauritaniaMauritiusMexicoMiddle East & North AfricaMiddle East & North Africa (excluding high income)Middle East & North Africa (IDA & IBRD countries)Middle incomeMoldovaMongoliaMontenegroMoroccoMozambiqueMyanmarNamibiaNepalNetherlandsNicaraguaNigerNigeriaNorth AmericaNorwayOECD membersOmanOther small statesPacific island small statesPakistanPanamaPapua New GuineaParaguayPeruPhilippinesPolandPortugalPost-demographic dividendPre-demographic dividendQatarRomaniaRussian FederationRwandaSamoaSan MarinoSao Tome and PrincipeSaudi ArabiaSenegalSerbiaSeychellesSierra LeoneSingaporeSlovak RepublicSloveniaSmall statesSolomon IslandsSouth AfricaSouth AsiaSouth Asia (IDA & IBRD)SpainSri LankaSt. Kitts and NevisSt. LuciaSt. Vincent and the GrenadinesSub-Saharan Africa Sub-Saharan Africa (excluding high income)Sub-Saharan Africa (IDA & IBRD countries)SudanSurinameSwazilandSwedenSwitzerlandSyrian Arab RepublicTajikistanTanzaniaThailandTimor-LesteTogoTongaTrinidad and TobagoTunisiaTurkeyUgandaUkraineUnited Arab EmiratesUpper middle incomeUruguayUzbekistanVanuatuVenezuela, RBVietnamWest Bank and GazaWorldYemen, Rep.ZambiaZimbabwe Timeline:
This timeline shows a graph from 1972 to 2014 of Benin. No data until 1971. Number of actual observations by date: 35.
Source name:
World Development Indicators
Source organization:
UNESCO Institute for Statistics
Categories, topics:
Education, Gender
Last updated:
apr 23, 2017
Indicators value changes by year
Minimum:
18.891
jan 1, 1991
Maximum:
66.366
jan 1, 2001
At the date of observation
Value
Absolute change
Change from previous value
jan 1, 1972
29.134
+29.134
0.0%
jan 1, 1973
30.848
+1.714
5.88%
jan 1, 1974
26.907
-3.94
-12.77%
jan 1, 1975
29.497
+2.59
9.62%
jan 1, 1976
26.749
-2.748
-9.31%
jan 1, 1977
32.155
+5.406
20.21%
jan 1, 1978
27.751
-4.404
-13.7%
jan 1, 1979
31.698
+3.947
14.22%
jan 1, 1980
26.337
-5.362
-16.91%
jan 1, 1981
36.236
+9.9
37.59%
jan 1, 1983
36.588
+0.352
0.97%
jan 1, 1984
36.683
+0.095
0.26%
jan 1, 1985
33.267
-3.416
-9.31%
jan 1, 1986
35.57
+2.303
6.92%
jan 1, 1987
33.844
-1.726
-4.85%
jan 1, 1988
29.402
-4.441
-13.12%
jan 1, 1989
28.434
-0.968
-3.29%
jan 1, 1990
28.79
+0.355
1.25%
jan 1, 1991
18.891
-9.898
-34.38%
jan 1, 1992
22.114
+3.223
17.06%
jan 1, 1993
22.382
+0.268
1.21%
jan 1, 1994
22.49
+0.108
0.48%
jan 1, 1995
23.728
+1.238
5.5%
jan 1, 1996
27.041
+3.314
13.96%
jan 1, 1997
26.979
-0.062
-0.23%
jan 1, 1998
26.278
-0.701
-2.6%
jan 1, 2001
66.366
+40.089
152.56%
jan 1, 2002
63.043
-3.324
-5.01%
jan 1, 2003
54.94
-8.103
-12.85%
jan 1, 2004
63.31
+8.37
15.24%
jan 1, 2010
51.352
-11.958
-18.89%
jan 1, 2011
52.957
+1.604
3.12%
jan 1, 2012
57.776
+4.82
9.1%
jan 1, 2013
51.538
-6.238
-10.8%
jan 1, 2014
52.328
+0.79
1.53%
Ranking of countries by current statistics by years


Comments: