29
/
en
AIzaSyAYiBZKx7MnpbEhh9jyipgxe19OcubqV5w
April 1, 2024
33893
European Union
EUU
false
2
1
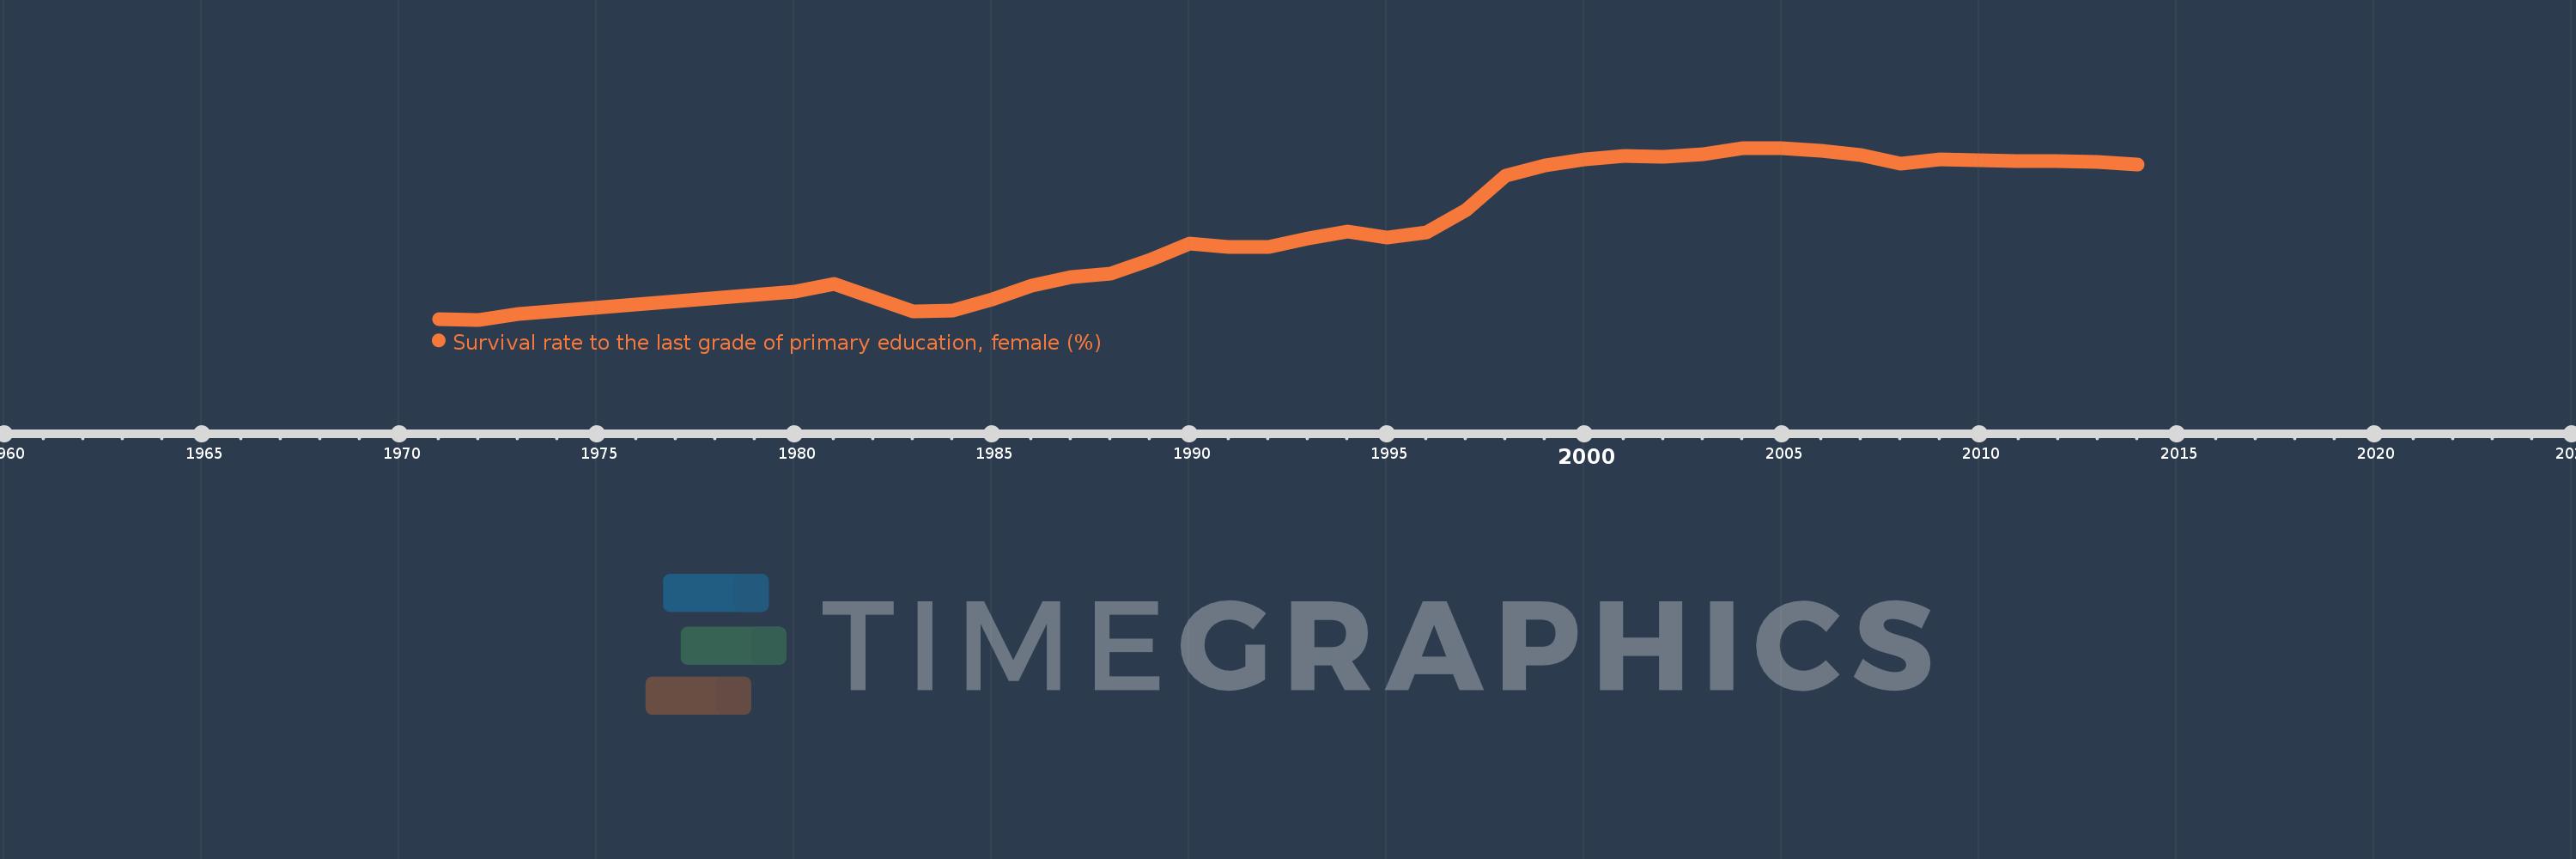
Survival rate to the last grade of primary education, female (%)
2014,2013,2012,2011,2010,2009,2008,2007,2006,2005,2004,2003,2002,2001,2000,1999,1998,1997,1996,1995,1994,1993,1992,1991,1990,1989,1988,1987,1986,1985,1984,1983,1982,1981,1980,1973,1972,1971
This statistics in other country:
AfghanistanAlbaniaAlgeriaAndorraAngolaArab WorldArgentinaArmeniaArubaAustriaAzerbaijanBahamas, TheBahrainBangladeshBarbadosBelarusBelgiumBelizeBeninBermudaBhutanBoliviaBosnia and HerzegovinaBotswanaBrazilBrunei DarussalamBulgariaBurkina FasoBurundiCabo VerdeCambodiaCameroonCanadaCaribbean small statesCentral African RepublicCentral Europe and the BalticsChadChileChinaColombiaComorosCongo, Dem. Rep.Congo, Rep.Costa RicaCote d'IvoireCroatiaCubaCyprusCzech RepublicDenmarkDjiboutiDominicaDominican RepublicEarly-demographic dividendEast Asia & PacificEast Asia & Pacific (excluding high income)East Asia & Pacific (IDA & IBRD countries)EcuadorEgypt, Arab Rep.El SalvadorEquatorial GuineaEritreaEstoniaEthiopiaEuro areaEurope & Central AsiaEurope & Central Asia (excluding high income)Europe & Central Asia (IDA & IBRD countries)European UnionFijiFinlandFragile and conflict affected situationsFranceGabonGambia, TheGeorgiaGermanyGhanaGreeceGuatemalaGuineaGuinea-BissauGuyanaHaitiHeavily indebted poor countries (HIPC)High incomeHondurasHong Kong SAR, ChinaHungaryIBRD onlyIcelandIDA & IBRD totalIDA blendIDA onlyIDA totalIndiaIndonesiaIran, Islamic Rep.IraqIsraelItalyJamaicaJapanJordanKazakhstanKenyaKiribatiKorea, Rep.KuwaitKyrgyz RepublicLao PDRLate-demographic dividendLatin America & Caribbean Latin America & Caribbean (excluding high income)Latin America & the Caribbean (IDA & IBRD countries)LatviaLeast developed countries: UN classificationLebanonLesothoLiberiaLibyaLiechtensteinLithuaniaLow & middle incomeLow incomeLower middle incomeLuxembourgMacao SAR, ChinaMacedonia, FYRMadagascarMalawiMalaysiaMaldivesMaliMaltaMarshall IslandsMauritaniaMauritiusMexicoMiddle East & North AfricaMiddle East & North Africa (excluding high income)Middle East & North Africa (IDA & IBRD countries)Middle incomeMoldovaMongoliaMontenegroMoroccoMozambiqueMyanmarNamibiaNepalNetherlandsNicaraguaNigerNigeriaNorth AmericaNorwayOECD membersOmanOther small statesPacific island small statesPakistanPanamaPapua New GuineaParaguayPeruPhilippinesPolandPortugalPost-demographic dividendPre-demographic dividendQatarRomaniaRussian FederationRwandaSamoaSan MarinoSao Tome and PrincipeSaudi ArabiaSenegalSerbiaSeychellesSierra LeoneSingaporeSlovak RepublicSloveniaSmall statesSolomon IslandsSouth AfricaSouth AsiaSouth Asia (IDA & IBRD)SpainSri LankaSt. Kitts and NevisSt. LuciaSt. Vincent and the GrenadinesSub-Saharan Africa Sub-Saharan Africa (excluding high income)Sub-Saharan Africa (IDA & IBRD countries)SudanSurinameSwazilandSwedenSwitzerlandSyrian Arab RepublicTajikistanTanzaniaThailandTimor-LesteTogoTongaTrinidad and TobagoTunisiaTurkeyUgandaUkraineUnited Arab EmiratesUpper middle incomeUruguayUzbekistanVanuatuVenezuela, RBVietnamWest Bank and GazaWorldYemen, Rep.ZambiaZimbabwe Timeline:
This timeline shows a graph from 1971 to 2014 of European Union. No data until 1970. Number of actual observations by date: 38.
Source name:
World Development Indicators
Source organization:
UNESCO Institute for Statistics
Categories, topics:
Education, Gender
Last updated:
apr 23, 2017
Indicators value changes by year
Minimum:
89.286
jan 1, 1972
At the date of observation
Value
Absolute change
Change from previous value
jan 1, 1971
89.322
+89.322
0.0%
jan 1, 1972
89.286
-0.035
-0.04%
jan 1, 1973
89.541
+0.255
0.29%
jan 1, 1980
90.591
+1.05
1.17%
jan 1, 1981
90.94
+0.349
0.39%
jan 1, 1982
90.312
-0.629
-0.69%
jan 1, 1983
89.69
-0.621
-0.69%
jan 1, 1984
89.697
+0.007
0.01%
jan 1, 1985
90.224
+0.527
0.59%
jan 1, 1986
90.86
+0.636
0.71%
jan 1, 1987
91.272
+0.413
0.45%
jan 1, 1988
91.416
+0.144
0.16%
jan 1, 1989
92.062
+0.646
0.71%
jan 1, 1990
92.806
+0.744
0.81%
jan 1, 1991
92.629
-0.177
-0.19%
jan 1, 1992
92.642
+0.013
0.01%
jan 1, 1993
93.048
+0.405
0.44%
jan 1, 1994
93.343
+0.295
0.32%
jan 1, 1995
93.084
-0.259
-0.28%
jan 1, 1996
93.298
+0.214
0.23%
jan 1, 1997
94.328
+1.029
1.1%
jan 1, 1998
95.913
+1.586
1.68%
jan 1, 1999
96.407
+0.494
0.51%
jan 1, 2000
96.664
+0.257
0.27%
jan 1, 2001
96.856
+0.192
0.2%
jan 1, 2002
96.804
-0.053
-0.05%
jan 1, 2003
96.926
+0.122
0.13%
jan 1, 2004
97.208
+0.282
0.29%
jan 1, 2005
97.21
+0.003
0.0%
jan 1, 2006
97.078
-0.133
-0.14%
jan 1, 2007
96.893
-0.185
-0.19%
jan 1, 2008
96.482
-0.411
-0.42%
jan 1, 2009
96.664
+0.182
0.19%
jan 1, 2010
96.635
-0.029
-0.03%
jan 1, 2011
96.621
-0.014
-0.01%
jan 1, 2012
96.622
+0.001
0.0%
jan 1, 2013
96.573
-0.049
-0.05%
jan 1, 2014
96.434
-0.139
-0.14%
Ranking of countries by current statistics by years


Comments: