29
/
en
AIzaSyAYiBZKx7MnpbEhh9jyipgxe19OcubqV5w
April 1, 2024
53822
Other small states
OSS
false
2
1
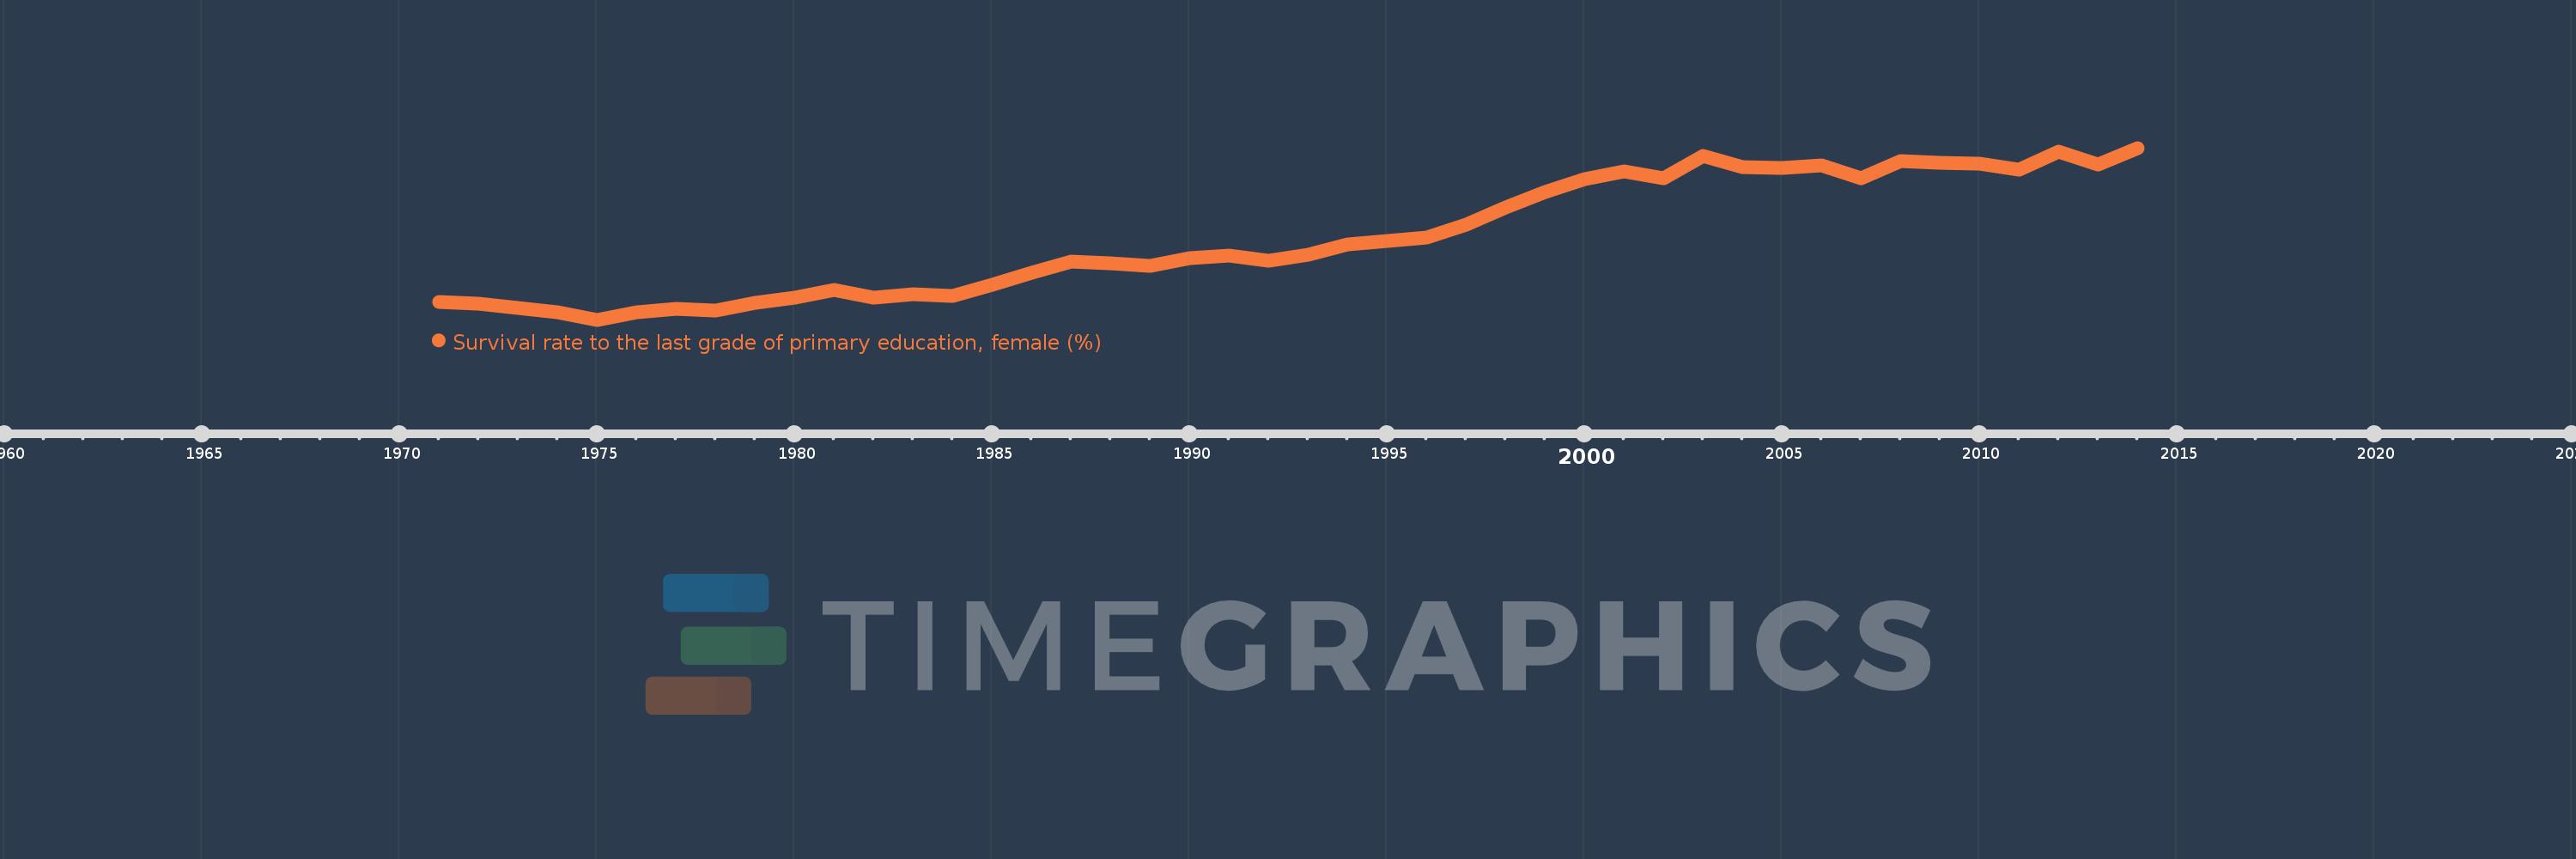
Survival rate to the last grade of primary education, female (%)
2014,2013,2012,2011,2010,2009,2008,2007,2006,2005,2004,2003,2002,2001,2000,1999,1998,1997,1996,1995,1994,1993,1992,1991,1990,1989,1988,1987,1986,1985,1984,1983,1982,1981,1980,1979,1978,1977,1976,1975,1974,1973,1972,1971
This statistics in other country:
AfghanistanAlbaniaAlgeriaAndorraAngolaArab WorldArgentinaArmeniaArubaAustriaAzerbaijanBahamas, TheBahrainBangladeshBarbadosBelarusBelgiumBelizeBeninBermudaBhutanBoliviaBosnia and HerzegovinaBotswanaBrazilBrunei DarussalamBulgariaBurkina FasoBurundiCabo VerdeCambodiaCameroonCanadaCaribbean small statesCentral African RepublicCentral Europe and the BalticsChadChileChinaColombiaComorosCongo, Dem. Rep.Congo, Rep.Costa RicaCote d'IvoireCroatiaCubaCyprusCzech RepublicDenmarkDjiboutiDominicaDominican RepublicEarly-demographic dividendEast Asia & PacificEast Asia & Pacific (excluding high income)East Asia & Pacific (IDA & IBRD countries)EcuadorEgypt, Arab Rep.El SalvadorEquatorial GuineaEritreaEstoniaEthiopiaEuro areaEurope & Central AsiaEurope & Central Asia (excluding high income)Europe & Central Asia (IDA & IBRD countries)European UnionFijiFinlandFragile and conflict affected situationsFranceGabonGambia, TheGeorgiaGermanyGhanaGreeceGuatemalaGuineaGuinea-BissauGuyanaHaitiHeavily indebted poor countries (HIPC)High incomeHondurasHong Kong SAR, ChinaHungaryIBRD onlyIcelandIDA & IBRD totalIDA blendIDA onlyIDA totalIndiaIndonesiaIran, Islamic Rep.IraqIsraelItalyJamaicaJapanJordanKazakhstanKenyaKiribatiKorea, Rep.KuwaitKyrgyz RepublicLao PDRLate-demographic dividendLatin America & Caribbean Latin America & Caribbean (excluding high income)Latin America & the Caribbean (IDA & IBRD countries)LatviaLeast developed countries: UN classificationLebanonLesothoLiberiaLibyaLiechtensteinLithuaniaLow & middle incomeLow incomeLower middle incomeLuxembourgMacao SAR, ChinaMacedonia, FYRMadagascarMalawiMalaysiaMaldivesMaliMaltaMarshall IslandsMauritaniaMauritiusMexicoMiddle East & North AfricaMiddle East & North Africa (excluding high income)Middle East & North Africa (IDA & IBRD countries)Middle incomeMoldovaMongoliaMontenegroMoroccoMozambiqueMyanmarNamibiaNepalNetherlandsNicaraguaNigerNigeriaNorth AmericaNorwayOECD membersOmanOther small statesPacific island small statesPakistanPanamaPapua New GuineaParaguayPeruPhilippinesPolandPortugalPost-demographic dividendPre-demographic dividendQatarRomaniaRussian FederationRwandaSamoaSan MarinoSao Tome and PrincipeSaudi ArabiaSenegalSerbiaSeychellesSierra LeoneSingaporeSlovak RepublicSloveniaSmall statesSolomon IslandsSouth AfricaSouth AsiaSouth Asia (IDA & IBRD)SpainSri LankaSt. Kitts and NevisSt. LuciaSt. Vincent and the GrenadinesSub-Saharan Africa Sub-Saharan Africa (excluding high income)Sub-Saharan Africa (IDA & IBRD countries)SudanSurinameSwazilandSwedenSwitzerlandSyrian Arab RepublicTajikistanTanzaniaThailandTimor-LesteTogoTongaTrinidad and TobagoTunisiaTurkeyUgandaUkraineUnited Arab EmiratesUpper middle incomeUruguayUzbekistanVanuatuVenezuela, RBVietnamWest Bank and GazaWorldYemen, Rep.ZambiaZimbabwe Timeline:
This timeline shows a graph from 1971 to 2014 of Other small states. No data until 1970. Number of actual observations by date: 44.
Source name:
World Development Indicators
Source organization:
UNESCO Institute for Statistics
Categories, topics:
Education, Gender
Last updated:
apr 23, 2017
Indicators value changes by year
Minimum:
52.091
jan 1, 1975
Maximum:
74.026
jan 1, 2014
At the date of observation
Value
Absolute change
Change from previous value
jan 1, 1971
54.316
+54.316
0.0%
jan 1, 1972
54.115
-0.201
-0.37%
jan 1, 1973
53.601
-0.514
-0.95%
jan 1, 1974
53.053
-0.548
-1.02%
jan 1, 1975
52.091
-0.962
-1.81%
jan 1, 1976
53.079
+0.987
1.9%
jan 1, 1977
53.435
+0.356
0.67%
jan 1, 1978
53.215
-0.22
-0.41%
jan 1, 1979
54.29
+1.075
2.02%
jan 1, 1980
54.869
+0.579
1.07%
jan 1, 1981
55.843
+0.974
1.77%
jan 1, 1982
54.859
-0.984
-1.76%
jan 1, 1983
55.354
+0.495
0.9%
jan 1, 1984
55.16
-0.194
-0.35%
jan 1, 1985
56.531
+1.371
2.49%
jan 1, 1986
58.105
+1.574
2.78%
jan 1, 1987
59.485
+1.38
2.38%
jan 1, 1988
59.305
-0.18
-0.3%
jan 1, 1989
58.961
-0.345
-0.58%
jan 1, 1990
59.946
+0.985
1.67%
jan 1, 1991
60.299
+0.353
0.59%
jan 1, 1992
59.632
-0.667
-1.11%
jan 1, 1993
60.349
+0.717
1.2%
jan 1, 1994
61.676
+1.328
2.2%
jan 1, 1995
62.099
+0.423
0.69%
jan 1, 1996
62.635
+0.536
0.86%
jan 1, 1997
64.183
+1.549
2.47%
jan 1, 1998
66.386
+2.202
3.43%
jan 1, 1999
68.372
+1.987
2.99%
jan 1, 2000
70.091
+1.718
2.51%
jan 1, 2001
71.029
+0.938
1.34%
jan 1, 2002
70.199
-0.829
-1.17%
jan 1, 2003
73.015
+2.816
4.01%
jan 1, 2004
71.55
-1.465
-2.01%
jan 1, 2005
71.466
-0.084
-0.12%
jan 1, 2006
71.849
+0.383
0.54%
jan 1, 2007
70.129
-1.721
-2.39%
jan 1, 2008
72.373
+2.244
3.2%
jan 1, 2009
72.115
-0.258
-0.36%
jan 1, 2010
72.002
-0.112
-0.16%
jan 1, 2011
71.256
-0.746
-1.04%
jan 1, 2012
73.509
+2.253
3.16%
jan 1, 2013
71.86
-1.649
-2.24%
jan 1, 2014
74.026
+2.167
3.02%
Ranking of countries by current statistics by years


Comments: