29
/
en
AIzaSyAYiBZKx7MnpbEhh9jyipgxe19OcubqV5w
April 1, 2024
255852
Swaziland
SWZ
true
2
1
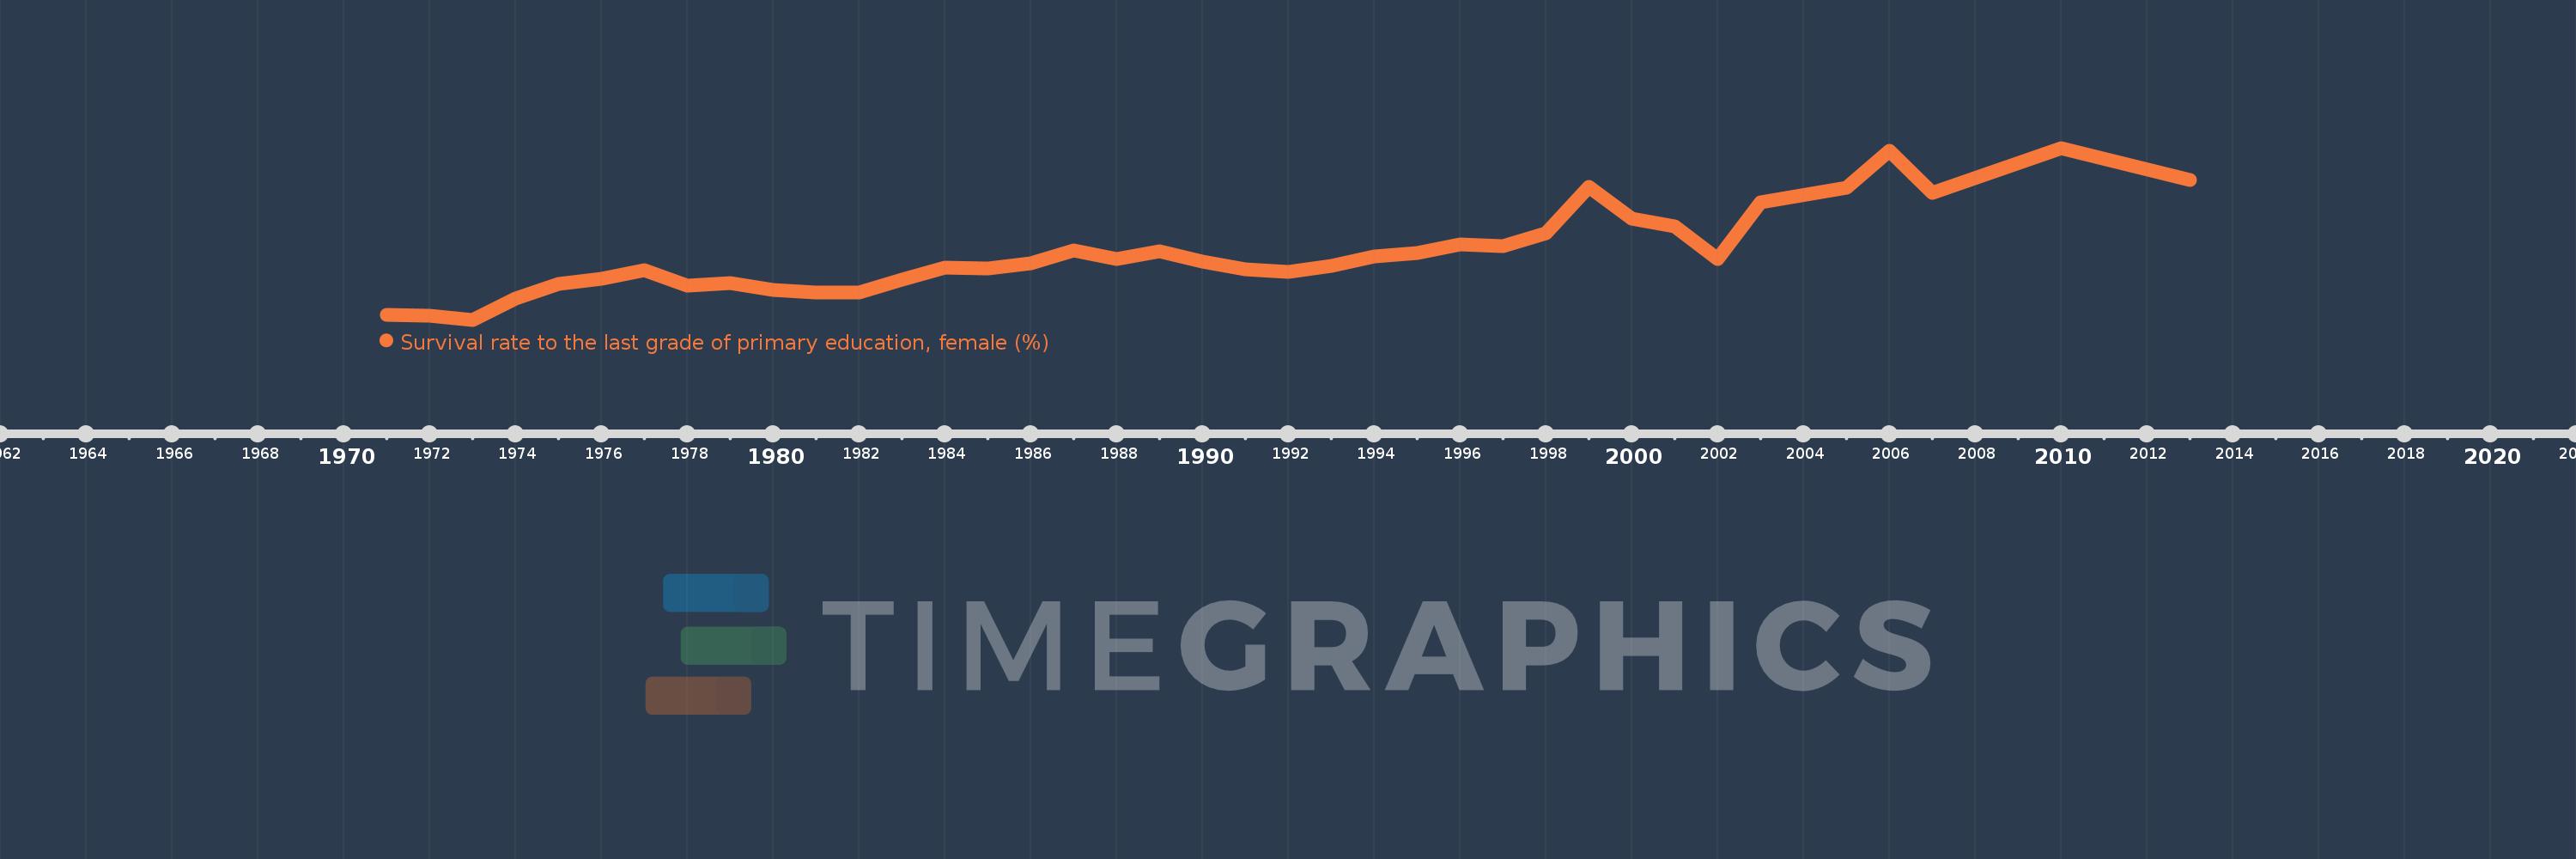
Survival rate to the last grade of primary education, female (%)
2013,2010,2007,2006,2005,2003,2002,2001,2000,1999,1998,1997,1996,1995,1994,1993,1992,1991,1990,1989,1988,1987,1986,1985,1984,1983,1982,1981,1980,1979,1978,1977,1976,1975,1974,1973,1972,1971
This statistics in other country:
AfghanistanAlbaniaAlgeriaAndorraAngolaArab WorldArgentinaArmeniaArubaAustriaAzerbaijanBahamas, TheBahrainBangladeshBarbadosBelarusBelgiumBelizeBeninBermudaBhutanBoliviaBosnia and HerzegovinaBotswanaBrazilBrunei DarussalamBulgariaBurkina FasoBurundiCabo VerdeCambodiaCameroonCanadaCaribbean small statesCentral African RepublicCentral Europe and the BalticsChadChileChinaColombiaComorosCongo, Dem. Rep.Congo, Rep.Costa RicaCote d'IvoireCroatiaCubaCyprusCzech RepublicDenmarkDjiboutiDominicaDominican RepublicEarly-demographic dividendEast Asia & PacificEast Asia & Pacific (excluding high income)East Asia & Pacific (IDA & IBRD countries)EcuadorEgypt, Arab Rep.El SalvadorEquatorial GuineaEritreaEstoniaEthiopiaEuro areaEurope & Central AsiaEurope & Central Asia (excluding high income)Europe & Central Asia (IDA & IBRD countries)European UnionFijiFinlandFragile and conflict affected situationsFranceGabonGambia, TheGeorgiaGermanyGhanaGreeceGuatemalaGuineaGuinea-BissauGuyanaHaitiHeavily indebted poor countries (HIPC)High incomeHondurasHong Kong SAR, ChinaHungaryIBRD onlyIcelandIDA & IBRD totalIDA blendIDA onlyIDA totalIndiaIndonesiaIran, Islamic Rep.IraqIsraelItalyJamaicaJapanJordanKazakhstanKenyaKiribatiKorea, Rep.KuwaitKyrgyz RepublicLao PDRLate-demographic dividendLatin America & Caribbean Latin America & Caribbean (excluding high income)Latin America & the Caribbean (IDA & IBRD countries)LatviaLeast developed countries: UN classificationLebanonLesothoLiberiaLibyaLiechtensteinLithuaniaLow & middle incomeLow incomeLower middle incomeLuxembourgMacao SAR, ChinaMacedonia, FYRMadagascarMalawiMalaysiaMaldivesMaliMaltaMarshall IslandsMauritaniaMauritiusMexicoMiddle East & North AfricaMiddle East & North Africa (excluding high income)Middle East & North Africa (IDA & IBRD countries)Middle incomeMoldovaMongoliaMontenegroMoroccoMozambiqueMyanmarNamibiaNepalNetherlandsNicaraguaNigerNigeriaNorth AmericaNorwayOECD membersOmanOther small statesPacific island small statesPakistanPanamaPapua New GuineaParaguayPeruPhilippinesPolandPortugalPost-demographic dividendPre-demographic dividendQatarRomaniaRussian FederationRwandaSamoaSan MarinoSao Tome and PrincipeSaudi ArabiaSenegalSerbiaSeychellesSierra LeoneSingaporeSlovak RepublicSloveniaSmall statesSolomon IslandsSouth AfricaSouth AsiaSouth Asia (IDA & IBRD)SpainSri LankaSt. Kitts and NevisSt. LuciaSt. Vincent and the GrenadinesSub-Saharan Africa Sub-Saharan Africa (excluding high income)Sub-Saharan Africa (IDA & IBRD countries)SudanSurinameSwazilandSwedenSwitzerlandSyrian Arab RepublicTajikistanTanzaniaThailandTimor-LesteTogoTongaTrinidad and TobagoTunisiaTurkeyUgandaUkraineUnited Arab EmiratesUpper middle incomeUruguayUzbekistanVanuatuVenezuela, RBVietnamWest Bank and GazaWorldYemen, Rep.ZambiaZimbabwe Timeline:
This timeline shows a graph from 1971 to 2013 of Swaziland. No data until 1970. Number of actual observations by date: 38.
Source name:
World Development Indicators
Source organization:
UNESCO Institute for Statistics
Categories, topics:
Education, Gender
Last updated:
apr 23, 2017
Indicators value changes by year
Minimum:
36.586
jan 1, 1973
Maximum:
86.711
jan 1, 2010
At the date of observation
Value
Absolute change
Change from previous value
jan 1, 1971
37.91
+37.91
0.0%
jan 1, 1972
37.832
-0.078
-0.21%
jan 1, 1973
36.586
-1.246
-3.29%
jan 1, 1974
42.806
+6.22
17.0%
jan 1, 1975
46.912
+4.105
9.59%
jan 1, 1976
48.437
+1.525
3.25%
jan 1, 1977
51.057
+2.62
5.41%
jan 1, 1978
46.543
-4.514
-8.84%
jan 1, 1979
47.316
+0.773
1.66%
jan 1, 1980
45.329
-1.987
-4.2%
jan 1, 1981
44.638
-0.691
-1.53%
jan 1, 1982
44.526
-0.112
-0.25%
jan 1, 1983
48.243
+3.717
8.35%
jan 1, 1984
51.916
+3.673
7.61%
jan 1, 1985
51.634
-0.282
-0.54%
jan 1, 1986
52.95
+1.316
2.55%
jan 1, 1987
56.688
+3.738
7.06%
jan 1, 1988
54.231
-2.457
-4.33%
jan 1, 1989
56.572
+2.341
4.32%
jan 1, 1990
53.459
-3.112
-5.5%
jan 1, 1991
51.396
-2.063
-3.86%
jan 1, 1992
50.576
-0.821
-1.6%
jan 1, 1993
52.354
+1.779
3.52%
jan 1, 1994
55.115
+2.761
5.27%
jan 1, 1995
56.036
+0.921
1.67%
jan 1, 1996
58.574
+2.538
4.53%
jan 1, 1997
58.096
-0.478
-0.82%
jan 1, 1998
61.765
+3.669
6.32%
jan 1, 1999
75.449
+13.684
22.15%
jan 1, 2000
66.197
-9.252
-12.26%
jan 1, 2001
63.882
-2.315
-3.5%
jan 1, 2002
54.287
-9.595
-15.02%
jan 1, 2003
70.918
+16.632
30.64%
jan 1, 2005
75.164
+4.245
5.99%
jan 1, 2006
85.896
+10.733
14.28%
jan 1, 2007
73.552
-12.345
-14.37%
jan 1, 2010
86.711
+13.159
17.89%
jan 1, 2013
77.373
-9.337
-10.77%
Ranking of countries by current statistics by years


Comments: