29
/
en
AIzaSyAYiBZKx7MnpbEhh9jyipgxe19OcubqV5w
April 1, 2024
221597
Paraguay
PRY
true
2
1
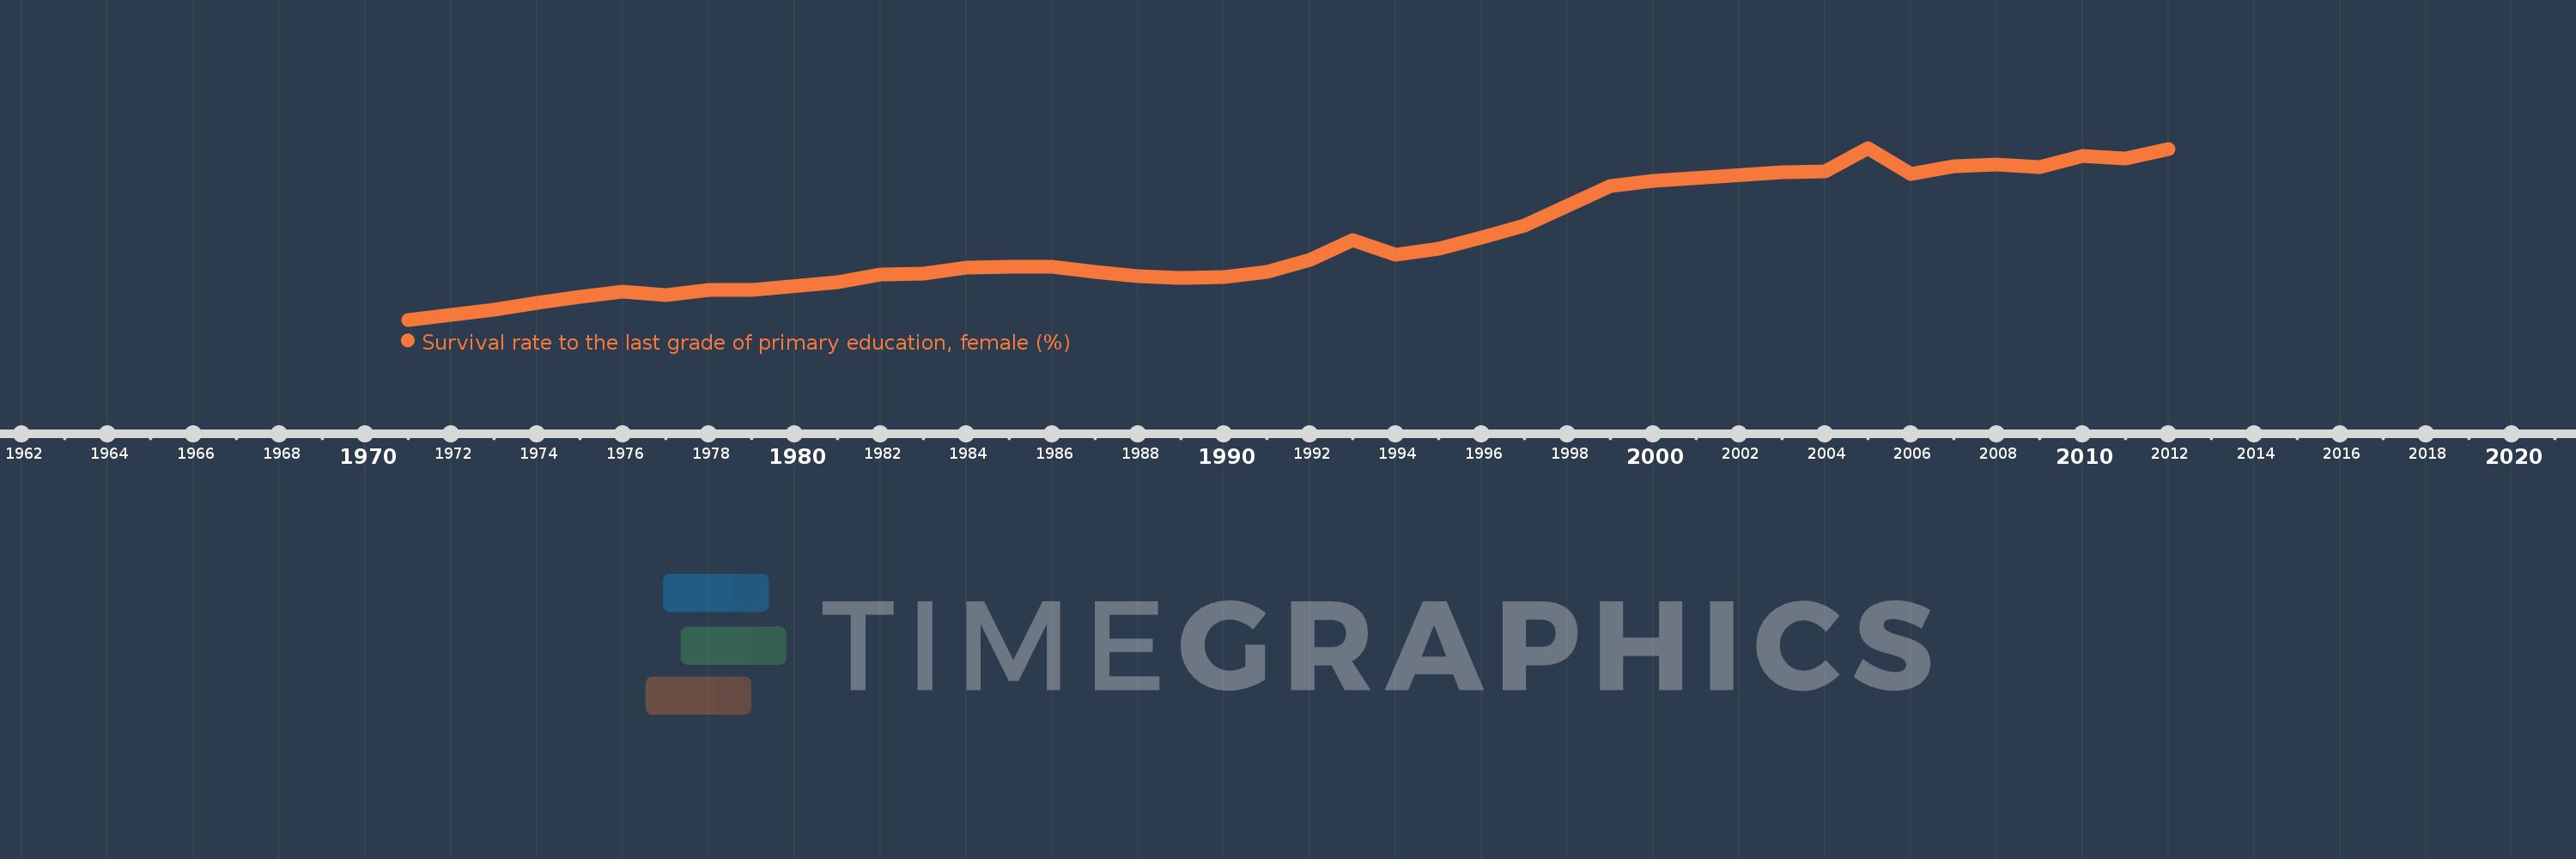
Survival rate to the last grade of primary education, female (%)
2012,2011,2010,2009,2008,2007,2006,2005,2004,2003,2000,1999,1997,1996,1995,1994,1993,1992,1991,1990,1989,1988,1987,1986,1985,1984,1983,1982,1981,1979,1978,1977,1976,1975,1974,1973,1971
This statistics in other country:
AfghanistanAlbaniaAlgeriaAndorraAngolaArab WorldArgentinaArmeniaArubaAustriaAzerbaijanBahamas, TheBahrainBangladeshBarbadosBelarusBelgiumBelizeBeninBermudaBhutanBoliviaBosnia and HerzegovinaBotswanaBrazilBrunei DarussalamBulgariaBurkina FasoBurundiCabo VerdeCambodiaCameroonCanadaCaribbean small statesCentral African RepublicCentral Europe and the BalticsChadChileChinaColombiaComorosCongo, Dem. Rep.Congo, Rep.Costa RicaCote d'IvoireCroatiaCubaCyprusCzech RepublicDenmarkDjiboutiDominicaDominican RepublicEarly-demographic dividendEast Asia & PacificEast Asia & Pacific (excluding high income)East Asia & Pacific (IDA & IBRD countries)EcuadorEgypt, Arab Rep.El SalvadorEquatorial GuineaEritreaEstoniaEthiopiaEuro areaEurope & Central AsiaEurope & Central Asia (excluding high income)Europe & Central Asia (IDA & IBRD countries)European UnionFijiFinlandFragile and conflict affected situationsFranceGabonGambia, TheGeorgiaGermanyGhanaGreeceGuatemalaGuineaGuinea-BissauGuyanaHaitiHeavily indebted poor countries (HIPC)High incomeHondurasHong Kong SAR, ChinaHungaryIBRD onlyIcelandIDA & IBRD totalIDA blendIDA onlyIDA totalIndiaIndonesiaIran, Islamic Rep.IraqIsraelItalyJamaicaJapanJordanKazakhstanKenyaKiribatiKorea, Rep.KuwaitKyrgyz RepublicLao PDRLate-demographic dividendLatin America & Caribbean Latin America & Caribbean (excluding high income)Latin America & the Caribbean (IDA & IBRD countries)LatviaLeast developed countries: UN classificationLebanonLesothoLiberiaLibyaLiechtensteinLithuaniaLow & middle incomeLow incomeLower middle incomeLuxembourgMacao SAR, ChinaMacedonia, FYRMadagascarMalawiMalaysiaMaldivesMaliMaltaMarshall IslandsMauritaniaMauritiusMexicoMiddle East & North AfricaMiddle East & North Africa (excluding high income)Middle East & North Africa (IDA & IBRD countries)Middle incomeMoldovaMongoliaMontenegroMoroccoMozambiqueMyanmarNamibiaNepalNetherlandsNicaraguaNigerNigeriaNorth AmericaNorwayOECD membersOmanOther small statesPacific island small statesPakistanPanamaPapua New GuineaParaguayPeruPhilippinesPolandPortugalPost-demographic dividendPre-demographic dividendQatarRomaniaRussian FederationRwandaSamoaSan MarinoSao Tome and PrincipeSaudi ArabiaSenegalSerbiaSeychellesSierra LeoneSingaporeSlovak RepublicSloveniaSmall statesSolomon IslandsSouth AfricaSouth AsiaSouth Asia (IDA & IBRD)SpainSri LankaSt. Kitts and NevisSt. LuciaSt. Vincent and the GrenadinesSub-Saharan Africa Sub-Saharan Africa (excluding high income)Sub-Saharan Africa (IDA & IBRD countries)SudanSurinameSwazilandSwedenSwitzerlandSyrian Arab RepublicTajikistanTanzaniaThailandTimor-LesteTogoTongaTrinidad and TobagoTunisiaTurkeyUgandaUkraineUnited Arab EmiratesUpper middle incomeUruguayUzbekistanVanuatuVenezuela, RBVietnamWest Bank and GazaWorldYemen, Rep.ZambiaZimbabwe Timeline:
This timeline shows a graph from 1971 to 2012 of Paraguay. No data until 1970. Number of actual observations by date: 37.
Source name:
World Development Indicators
Source organization:
UNESCO Institute for Statistics
Categories, topics:
Education, Gender
Last updated:
apr 23, 2017
Indicators value changes by year
Minimum:
29.986
jan 1, 1971
Maximum:
86.405
jan 1, 2005
At the date of observation
Value
Absolute change
Change from previous value
jan 1, 1971
29.986
+29.986
0.0%
jan 1, 1973
33.267
+3.28
10.94%
jan 1, 1974
35.471
+2.204
6.63%
jan 1, 1975
37.646
+2.175
6.13%
jan 1, 1976
39.241
+1.594
4.24%
jan 1, 1977
38.127
-1.114
-2.84%
jan 1, 1978
39.711
+1.584
4.16%
jan 1, 1979
39.784
+0.073
0.18%
jan 1, 1981
42.183
+2.399
6.03%
jan 1, 1982
44.833
+2.65
6.28%
jan 1, 1983
45.146
+0.313
0.7%
jan 1, 1984
47.001
+1.856
4.11%
jan 1, 1985
47.445
+0.443
0.94%
jan 1, 1986
47.286
-0.159
-0.34%
jan 1, 1987
45.604
-1.682
-3.56%
jan 1, 1988
44.153
-1.451
-3.18%
jan 1, 1989
43.725
-0.428
-0.97%
jan 1, 1990
44.095
+0.37
0.85%
jan 1, 1991
45.589
+1.494
3.39%
jan 1, 1992
49.611
+4.022
8.82%
jan 1, 1993
56.07
+6.459
13.02%
jan 1, 1994
51.349
-4.721
-8.42%
jan 1, 1995
53.456
+2.107
4.1%
jan 1, 1996
57.05
+3.594
6.72%
jan 1, 1997
61.013
+3.962
6.95%
jan 1, 1999
73.856
+12.843
21.05%
jan 1, 2000
75.667
+1.812
2.45%
jan 1, 2003
78.448
+2.781
3.67%
jan 1, 2004
78.706
+0.258
0.33%
jan 1, 2005
86.405
+7.699
9.78%
jan 1, 2006
77.978
-8.427
-9.75%
jan 1, 2007
80.331
+2.352
3.02%
jan 1, 2008
81.046
+0.716
0.89%
jan 1, 2009
80.25
-0.796
-0.98%
jan 1, 2010
83.874
+3.624
4.52%
jan 1, 2011
82.933
-0.94
-1.12%
jan 1, 2012
85.914
+2.98
3.59%
Ranking of countries by current statistics by years


Comments: