29
/
en
AIzaSyAYiBZKx7MnpbEhh9jyipgxe19OcubqV5w
April 1, 2024
219096
Panama
PAN
true
2
1
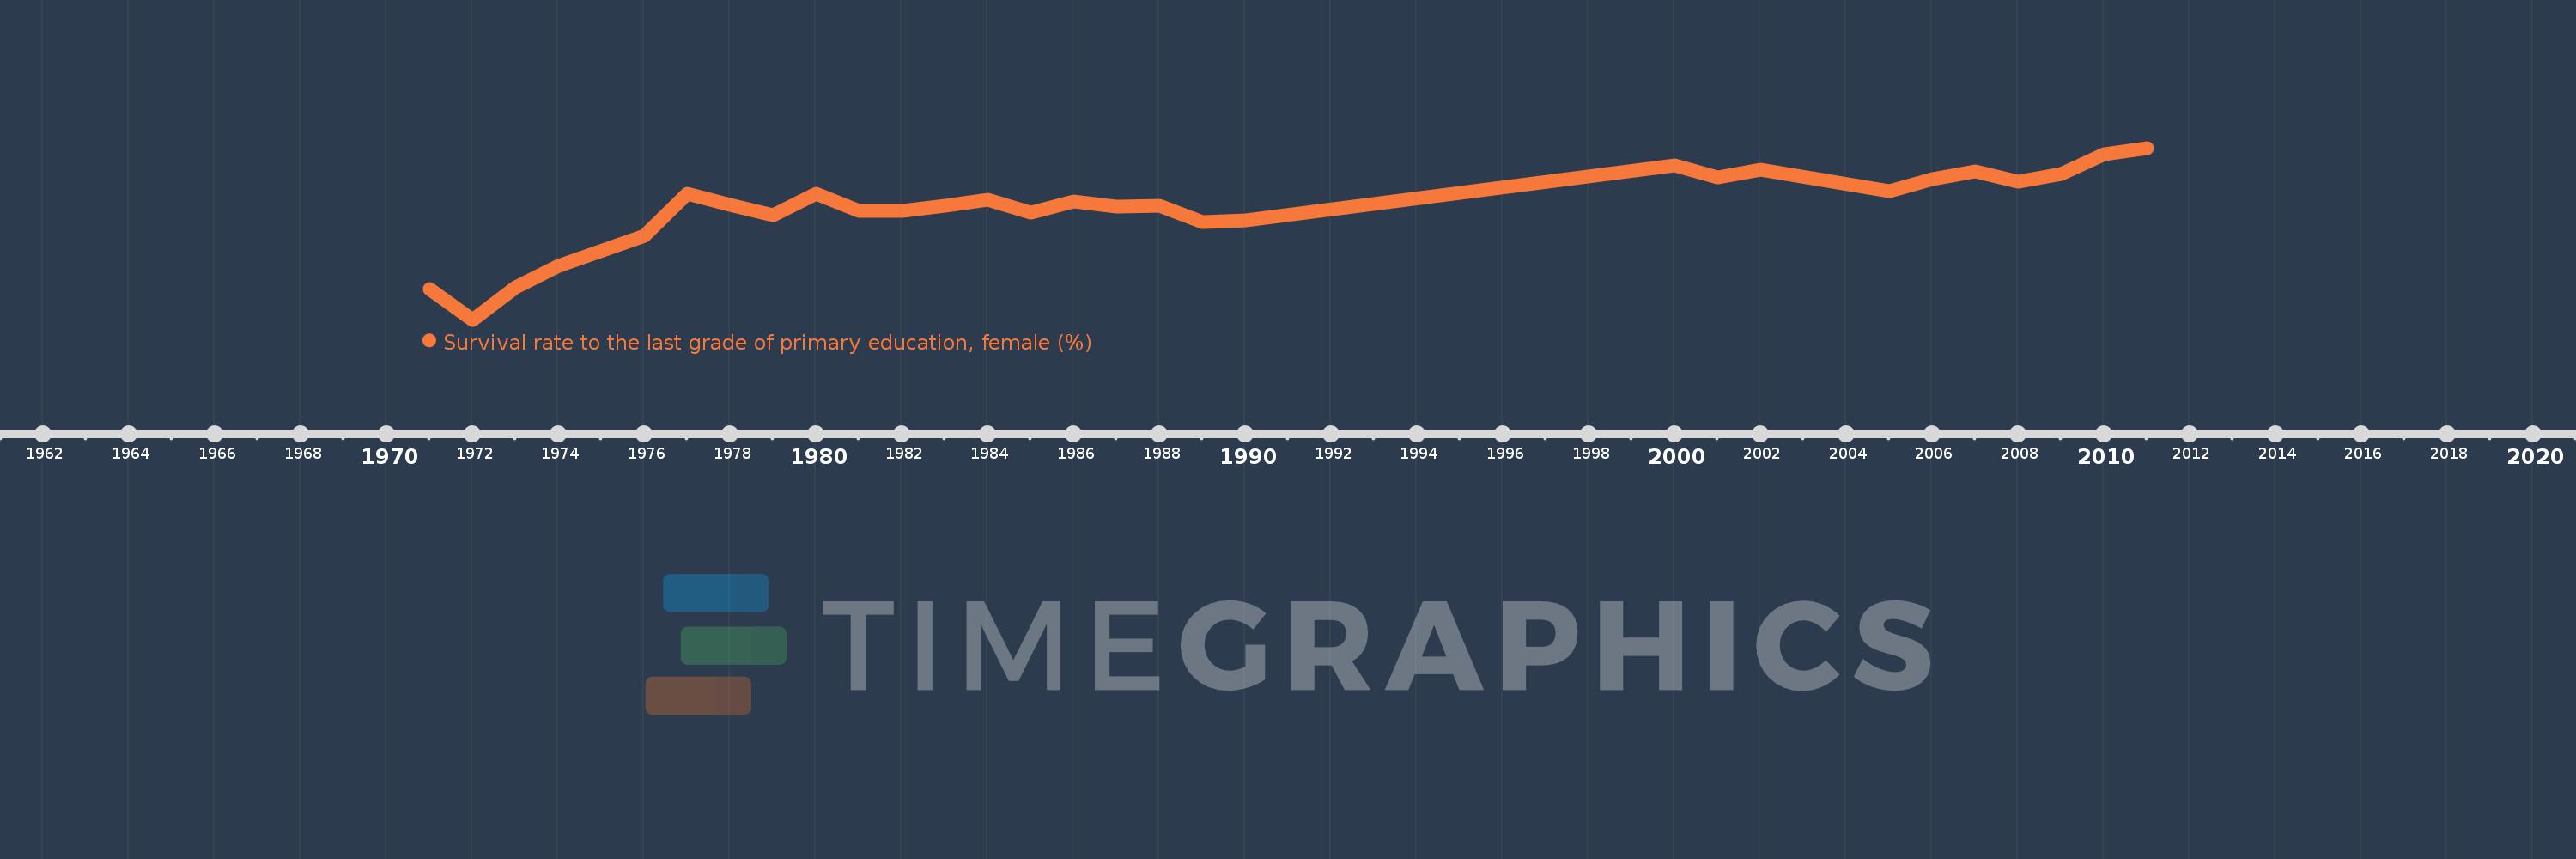
Survival rate to the last grade of primary education, female (%)
2011,2010,2009,2008,2007,2006,2005,2002,2001,2000,1990,1989,1988,1987,1986,1985,1984,1983,1982,1981,1980,1979,1978,1977,1976,1974,1973,1972,1971
This statistics in other country:
AfghanistanAlbaniaAlgeriaAndorraAngolaArab WorldArgentinaArmeniaArubaAustriaAzerbaijanBahamas, TheBahrainBangladeshBarbadosBelarusBelgiumBelizeBeninBermudaBhutanBoliviaBosnia and HerzegovinaBotswanaBrazilBrunei DarussalamBulgariaBurkina FasoBurundiCabo VerdeCambodiaCameroonCanadaCaribbean small statesCentral African RepublicCentral Europe and the BalticsChadChileChinaColombiaComorosCongo, Dem. Rep.Congo, Rep.Costa RicaCote d'IvoireCroatiaCubaCyprusCzech RepublicDenmarkDjiboutiDominicaDominican RepublicEarly-demographic dividendEast Asia & PacificEast Asia & Pacific (excluding high income)East Asia & Pacific (IDA & IBRD countries)EcuadorEgypt, Arab Rep.El SalvadorEquatorial GuineaEritreaEstoniaEthiopiaEuro areaEurope & Central AsiaEurope & Central Asia (excluding high income)Europe & Central Asia (IDA & IBRD countries)European UnionFijiFinlandFragile and conflict affected situationsFranceGabonGambia, TheGeorgiaGermanyGhanaGreeceGuatemalaGuineaGuinea-BissauGuyanaHaitiHeavily indebted poor countries (HIPC)High incomeHondurasHong Kong SAR, ChinaHungaryIBRD onlyIcelandIDA & IBRD totalIDA blendIDA onlyIDA totalIndiaIndonesiaIran, Islamic Rep.IraqIsraelItalyJamaicaJapanJordanKazakhstanKenyaKiribatiKorea, Rep.KuwaitKyrgyz RepublicLao PDRLate-demographic dividendLatin America & Caribbean Latin America & Caribbean (excluding high income)Latin America & the Caribbean (IDA & IBRD countries)LatviaLeast developed countries: UN classificationLebanonLesothoLiberiaLibyaLiechtensteinLithuaniaLow & middle incomeLow incomeLower middle incomeLuxembourgMacao SAR, ChinaMacedonia, FYRMadagascarMalawiMalaysiaMaldivesMaliMaltaMarshall IslandsMauritaniaMauritiusMexicoMiddle East & North AfricaMiddle East & North Africa (excluding high income)Middle East & North Africa (IDA & IBRD countries)Middle incomeMoldovaMongoliaMontenegroMoroccoMozambiqueMyanmarNamibiaNepalNetherlandsNicaraguaNigerNigeriaNorth AmericaNorwayOECD membersOmanOther small statesPacific island small statesPakistanPanamaPapua New GuineaParaguayPeruPhilippinesPolandPortugalPost-demographic dividendPre-demographic dividendQatarRomaniaRussian FederationRwandaSamoaSan MarinoSao Tome and PrincipeSaudi ArabiaSenegalSerbiaSeychellesSierra LeoneSingaporeSlovak RepublicSloveniaSmall statesSolomon IslandsSouth AfricaSouth AsiaSouth Asia (IDA & IBRD)SpainSri LankaSt. Kitts and NevisSt. LuciaSt. Vincent and the GrenadinesSub-Saharan Africa Sub-Saharan Africa (excluding high income)Sub-Saharan Africa (IDA & IBRD countries)SudanSurinameSwazilandSwedenSwitzerlandSyrian Arab RepublicTajikistanTanzaniaThailandTimor-LesteTogoTongaTrinidad and TobagoTunisiaTurkeyUgandaUkraineUnited Arab EmiratesUpper middle incomeUruguayUzbekistanVanuatuVenezuela, RBVietnamWest Bank and GazaWorldYemen, Rep.ZambiaZimbabwe Timeline:
This timeline shows a graph from 1971 to 2011 of Panama. No data until 1970. Number of actual observations by date: 29.
Source name:
World Development Indicators
Source organization:
UNESCO Institute for Statistics
Categories, topics:
Education, Gender
Last updated:
apr 23, 2017
Indicators value changes by year
Minimum:
44.021
jan 1, 1972
Maximum:
95.839
jan 1, 2011
At the date of observation
Value
Absolute change
Change from previous value
jan 1, 1971
53.245
+53.245
0.0%
jan 1, 1972
44.021
-9.224
-17.32%
jan 1, 1973
53.793
+9.772
22.2%
jan 1, 1974
60.214
+6.421
11.94%
jan 1, 1976
69.249
+9.035
15.01%
jan 1, 1977
82.13
+12.881
18.6%
jan 1, 1978
78.553
-3.577
-4.36%
jan 1, 1979
75.537
-3.016
-3.84%
jan 1, 1980
82.019
+6.482
8.58%
jan 1, 1981
76.804
-5.216
-6.36%
jan 1, 1982
76.869
+0.066
0.09%
jan 1, 1983
78.398
+1.529
1.99%
jan 1, 1984
80.303
+1.905
2.43%
jan 1, 1985
76.367
-3.936
-4.9%
jan 1, 1986
79.703
+3.335
4.37%
jan 1, 1987
78.021
-1.681
-2.11%
jan 1, 1988
78.455
+0.434
0.56%
jan 1, 1989
73.539
-4.916
-6.27%
jan 1, 1990
74.098
+0.558
0.76%
jan 1, 2000
90.513
+16.415
22.15%
jan 1, 2001
86.995
-3.518
-3.89%
jan 1, 2002
89.279
+2.284
2.63%
jan 1, 2005
82.792
-6.487
-7.27%
jan 1, 2006
86.438
+3.645
4.4%
jan 1, 2007
88.868
+2.43
2.81%
jan 1, 2008
85.718
-3.15
-3.54%
jan 1, 2009
87.946
+2.228
2.6%
jan 1, 2010
93.822
+5.876
6.68%
jan 1, 2011
95.839
+2.017
2.15%
Ranking of countries by current statistics by years


Comments: