29
/
en
AIzaSyAYiBZKx7MnpbEhh9jyipgxe19OcubqV5w
April 1, 2024
44684
Least developed countries: UN classification
LDC
false
2
1
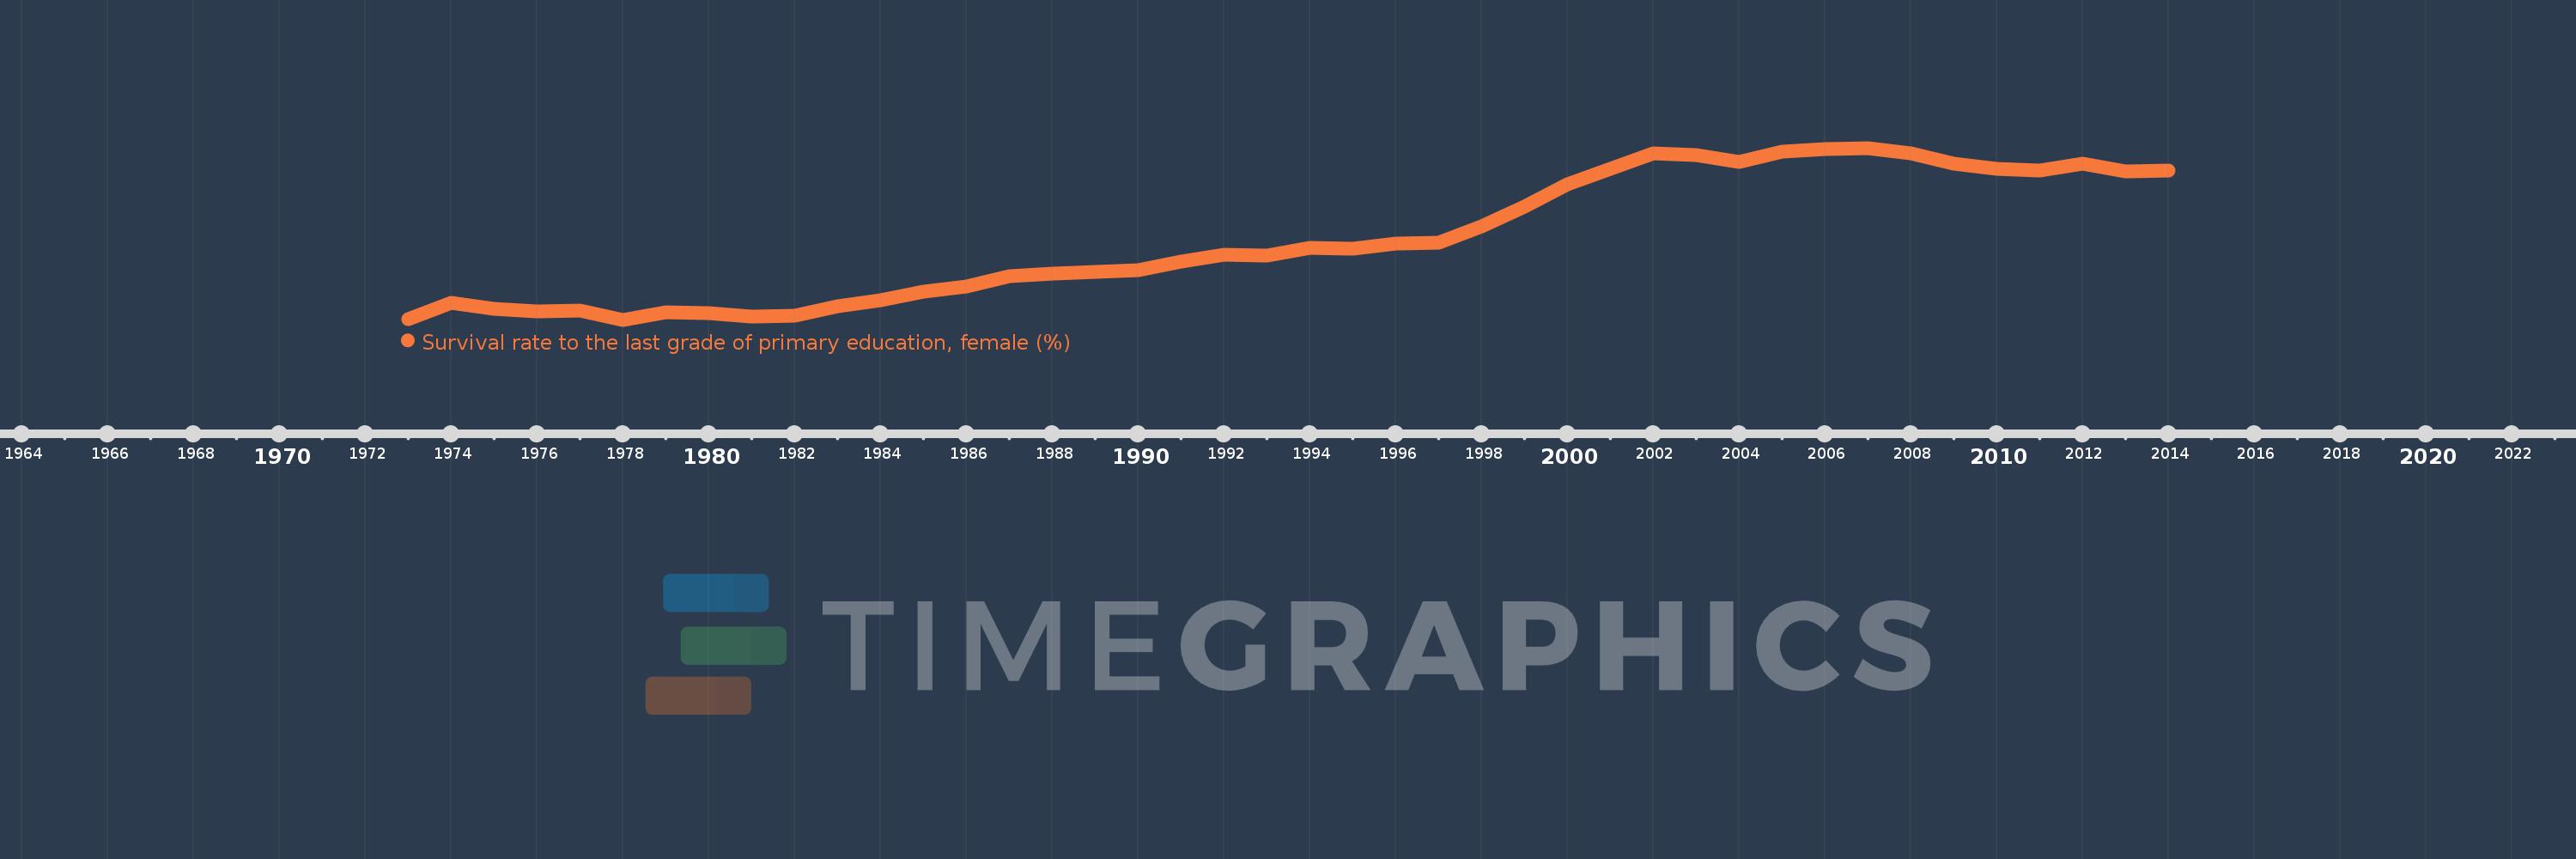
Survival rate to the last grade of primary education, female (%)
2014,2013,2012,2011,2010,2009,2008,2007,2006,2005,2004,2003,2002,2001,2000,1999,1998,1997,1996,1995,1994,1993,1992,1991,1990,1989,1988,1987,1986,1985,1984,1983,1982,1981,1980,1979,1978,1977,1976,1975,1974,1973
This statistics in other country:
AfghanistanAlbaniaAlgeriaAndorraAngolaArab WorldArgentinaArmeniaArubaAustriaAzerbaijanBahamas, TheBahrainBangladeshBarbadosBelarusBelgiumBelizeBeninBermudaBhutanBoliviaBosnia and HerzegovinaBotswanaBrazilBrunei DarussalamBulgariaBurkina FasoBurundiCabo VerdeCambodiaCameroonCanadaCaribbean small statesCentral African RepublicCentral Europe and the BalticsChadChileChinaColombiaComorosCongo, Dem. Rep.Congo, Rep.Costa RicaCote d'IvoireCroatiaCubaCyprusCzech RepublicDenmarkDjiboutiDominicaDominican RepublicEarly-demographic dividendEast Asia & PacificEast Asia & Pacific (excluding high income)East Asia & Pacific (IDA & IBRD countries)EcuadorEgypt, Arab Rep.El SalvadorEquatorial GuineaEritreaEstoniaEthiopiaEuro areaEurope & Central AsiaEurope & Central Asia (excluding high income)Europe & Central Asia (IDA & IBRD countries)European UnionFijiFinlandFragile and conflict affected situationsFranceGabonGambia, TheGeorgiaGermanyGhanaGreeceGuatemalaGuineaGuinea-BissauGuyanaHaitiHeavily indebted poor countries (HIPC)High incomeHondurasHong Kong SAR, ChinaHungaryIBRD onlyIcelandIDA & IBRD totalIDA blendIDA onlyIDA totalIndiaIndonesiaIran, Islamic Rep.IraqIsraelItalyJamaicaJapanJordanKazakhstanKenyaKiribatiKorea, Rep.KuwaitKyrgyz RepublicLao PDRLate-demographic dividendLatin America & Caribbean Latin America & Caribbean (excluding high income)Latin America & the Caribbean (IDA & IBRD countries)LatviaLeast developed countries: UN classificationLebanonLesothoLiberiaLibyaLiechtensteinLithuaniaLow & middle incomeLow incomeLower middle incomeLuxembourgMacao SAR, ChinaMacedonia, FYRMadagascarMalawiMalaysiaMaldivesMaliMaltaMarshall IslandsMauritaniaMauritiusMexicoMiddle East & North AfricaMiddle East & North Africa (excluding high income)Middle East & North Africa (IDA & IBRD countries)Middle incomeMoldovaMongoliaMontenegroMoroccoMozambiqueMyanmarNamibiaNepalNetherlandsNicaraguaNigerNigeriaNorth AmericaNorwayOECD membersOmanOther small statesPacific island small statesPakistanPanamaPapua New GuineaParaguayPeruPhilippinesPolandPortugalPost-demographic dividendPre-demographic dividendQatarRomaniaRussian FederationRwandaSamoaSan MarinoSao Tome and PrincipeSaudi ArabiaSenegalSerbiaSeychellesSierra LeoneSingaporeSlovak RepublicSloveniaSmall statesSolomon IslandsSouth AfricaSouth AsiaSouth Asia (IDA & IBRD)SpainSri LankaSt. Kitts and NevisSt. LuciaSt. Vincent and the GrenadinesSub-Saharan Africa Sub-Saharan Africa (excluding high income)Sub-Saharan Africa (IDA & IBRD countries)SudanSurinameSwazilandSwedenSwitzerlandSyrian Arab RepublicTajikistanTanzaniaThailandTimor-LesteTogoTongaTrinidad and TobagoTunisiaTurkeyUgandaUkraineUnited Arab EmiratesUpper middle incomeUruguayUzbekistanVanuatuVenezuela, RBVietnamWest Bank and GazaWorldYemen, Rep.ZambiaZimbabwe Timeline:
This timeline shows a graph from 1973 to 2014 of Least developed countries: UN classification. No data until 1972. Number of actual observations by date: 42.
Source name:
World Development Indicators
Source organization:
UNESCO Institute for Statistics
Categories, topics:
Education, Gender
Last updated:
apr 23, 2017
Indicators value changes by year
Minimum:
31.059
jan 1, 1978
At the date of observation
Value
Absolute change
Change from previous value
jan 1, 1973
31.139
+31.139
0.0%
jan 1, 1974
33.77
+2.631
8.45%
jan 1, 1975
32.72
-1.05
-3.11%
jan 1, 1976
32.358
-0.362
-1.11%
jan 1, 1977
32.482
+0.124
0.38%
jan 1, 1978
31.059
-1.423
-4.38%
jan 1, 1979
32.249
+1.19
3.83%
jan 1, 1980
32.139
-0.11
-0.34%
jan 1, 1981
31.554
-0.585
-1.82%
jan 1, 1982
31.722
+0.168
0.53%
jan 1, 1983
33.172
+1.449
4.57%
jan 1, 1984
34.078
+0.907
2.73%
jan 1, 1985
35.491
+1.413
4.15%
jan 1, 1986
36.271
+0.78
2.2%
jan 1, 1987
37.897
+1.626
4.48%
jan 1, 1988
38.311
+0.414
1.09%
jan 1, 1989
38.624
+0.313
0.82%
jan 1, 1990
38.875
+0.25
0.65%
jan 1, 1991
40.224
+1.35
3.47%
jan 1, 1992
41.229
+1.004
2.5%
jan 1, 1993
41.063
-0.166
-0.4%
jan 1, 1994
42.368
+1.305
3.18%
jan 1, 1995
42.226
-0.142
-0.33%
jan 1, 1996
43.061
+0.834
1.98%
jan 1, 1997
43.193
+0.133
0.31%
jan 1, 1998
45.678
+2.485
5.75%
jan 1, 1999
48.785
+3.107
6.8%
jan 1, 2000
52.296
+3.511
7.2%
jan 1, 2001
54.773
+2.477
4.74%
jan 1, 2002
57.144
+2.371
4.33%
jan 1, 2003
56.903
-0.242
-0.42%
jan 1, 2004
55.89
-1.013
-1.78%
jan 1, 2005
57.381
+1.491
2.67%
jan 1, 2006
57.795
+0.414
0.72%
jan 1, 2007
58.02
+0.225
0.39%
jan 1, 2008
57.229
-0.791
-1.36%
jan 1, 2009
55.583
-1.646
-2.88%
jan 1, 2010
54.757
-0.826
-1.49%
jan 1, 2011
54.448
-0.309
-0.56%
jan 1, 2012
55.573
+1.125
2.07%
jan 1, 2013
54.357
-1.216
-2.19%
jan 1, 2014
54.457
+0.1
0.18%
Ranking of countries by current statistics by years


Comments: