29
/
en
AIzaSyAYiBZKx7MnpbEhh9jyipgxe19OcubqV5w
April 1, 2024
40365
IDA total
IDA
false
2
1
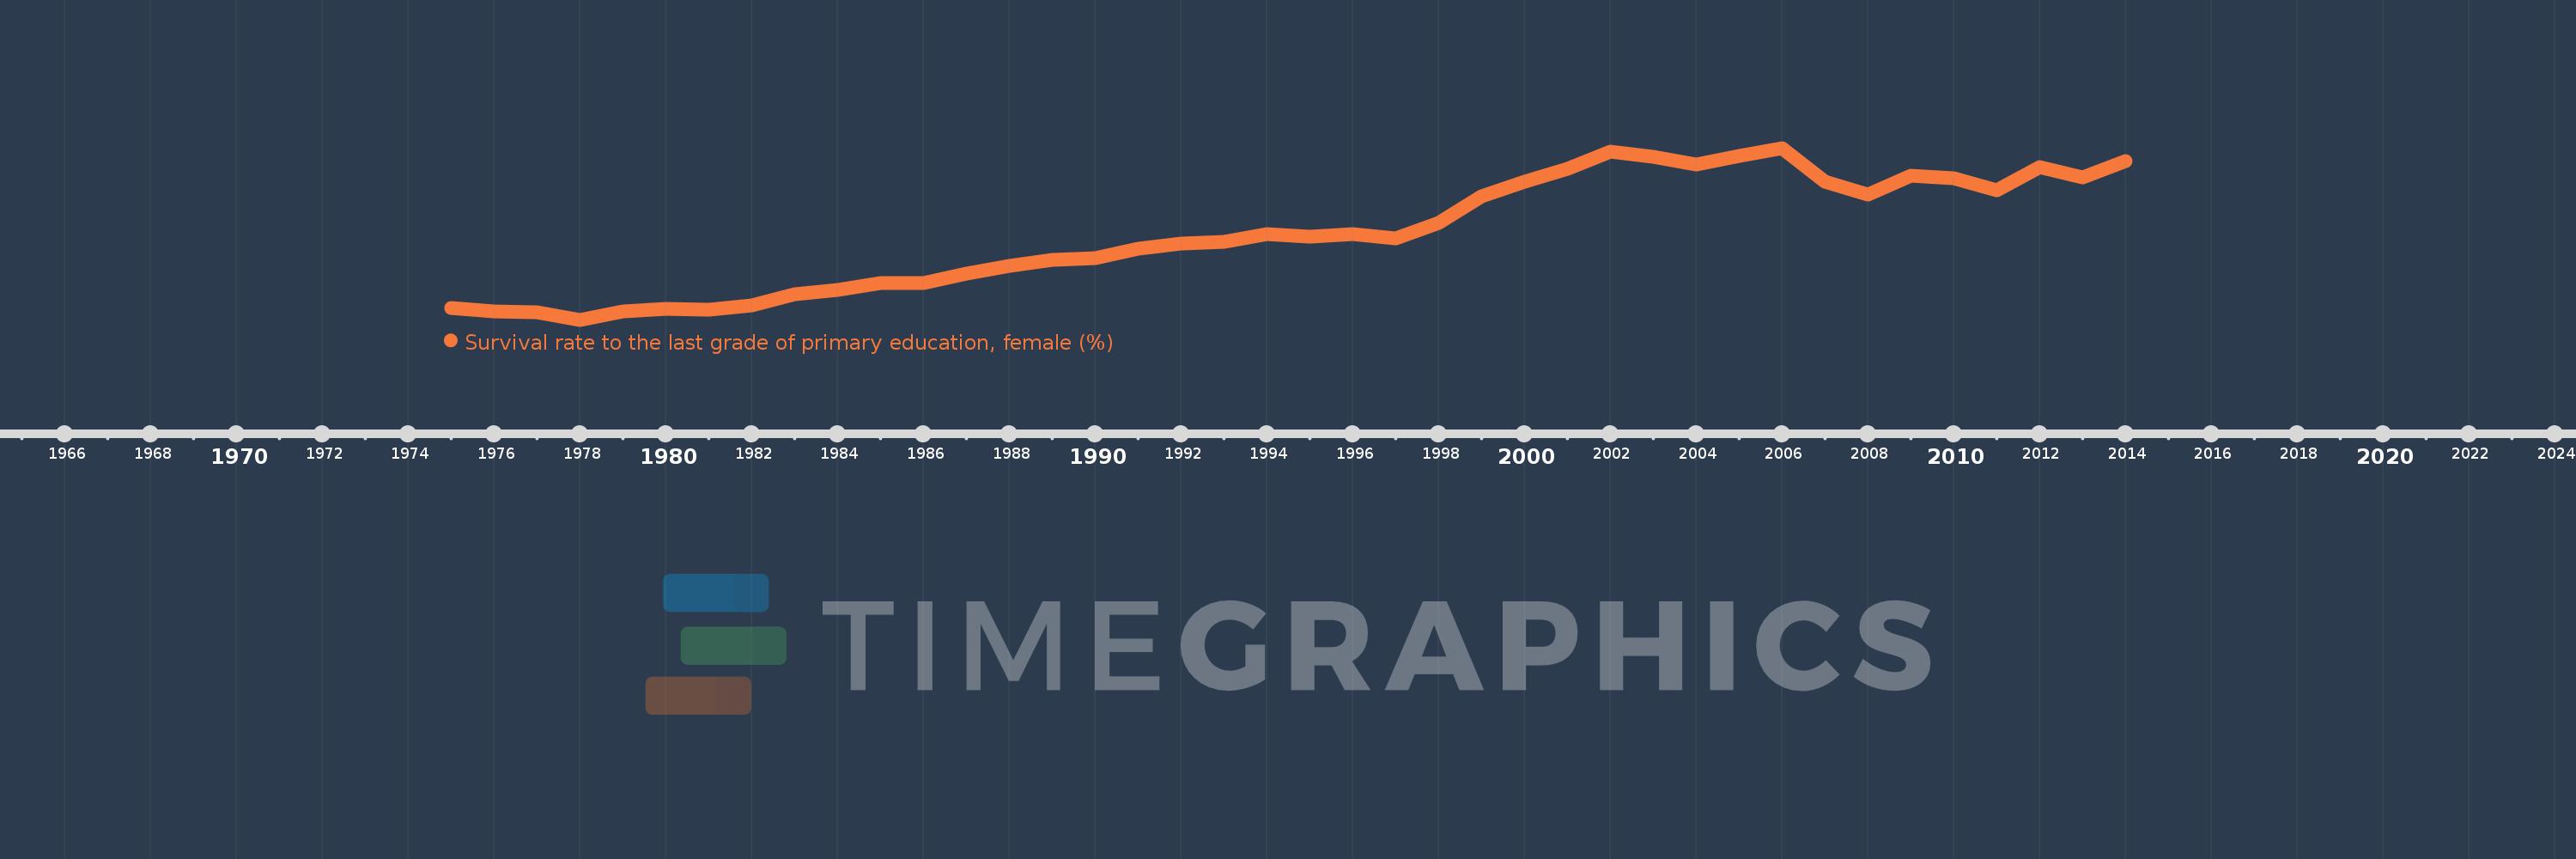
Survival rate to the last grade of primary education, female (%)
2014,2013,2012,2011,2010,2009,2008,2007,2006,2005,2004,2003,2002,2001,2000,1999,1998,1997,1996,1995,1994,1993,1992,1991,1990,1989,1988,1987,1986,1985,1984,1983,1982,1981,1980,1979,1978,1977,1976,1975
This statistics in other country:
AfghanistanAlbaniaAlgeriaAndorraAngolaArab WorldArgentinaArmeniaArubaAustriaAzerbaijanBahamas, TheBahrainBangladeshBarbadosBelarusBelgiumBelizeBeninBermudaBhutanBoliviaBosnia and HerzegovinaBotswanaBrazilBrunei DarussalamBulgariaBurkina FasoBurundiCabo VerdeCambodiaCameroonCanadaCaribbean small statesCentral African RepublicCentral Europe and the BalticsChadChileChinaColombiaComorosCongo, Dem. Rep.Congo, Rep.Costa RicaCote d'IvoireCroatiaCubaCyprusCzech RepublicDenmarkDjiboutiDominicaDominican RepublicEarly-demographic dividendEast Asia & PacificEast Asia & Pacific (excluding high income)East Asia & Pacific (IDA & IBRD countries)EcuadorEgypt, Arab Rep.El SalvadorEquatorial GuineaEritreaEstoniaEthiopiaEuro areaEurope & Central AsiaEurope & Central Asia (excluding high income)Europe & Central Asia (IDA & IBRD countries)European UnionFijiFinlandFragile and conflict affected situationsFranceGabonGambia, TheGeorgiaGermanyGhanaGreeceGuatemalaGuineaGuinea-BissauGuyanaHaitiHeavily indebted poor countries (HIPC)High incomeHondurasHong Kong SAR, ChinaHungaryIBRD onlyIcelandIDA & IBRD totalIDA blendIDA onlyIDA totalIndiaIndonesiaIran, Islamic Rep.IraqIsraelItalyJamaicaJapanJordanKazakhstanKenyaKiribatiKorea, Rep.KuwaitKyrgyz RepublicLao PDRLate-demographic dividendLatin America & Caribbean Latin America & Caribbean (excluding high income)Latin America & the Caribbean (IDA & IBRD countries)LatviaLeast developed countries: UN classificationLebanonLesothoLiberiaLibyaLiechtensteinLithuaniaLow & middle incomeLow incomeLower middle incomeLuxembourgMacao SAR, ChinaMacedonia, FYRMadagascarMalawiMalaysiaMaldivesMaliMaltaMarshall IslandsMauritaniaMauritiusMexicoMiddle East & North AfricaMiddle East & North Africa (excluding high income)Middle East & North Africa (IDA & IBRD countries)Middle incomeMoldovaMongoliaMontenegroMoroccoMozambiqueMyanmarNamibiaNepalNetherlandsNicaraguaNigerNigeriaNorth AmericaNorwayOECD membersOmanOther small statesPacific island small statesPakistanPanamaPapua New GuineaParaguayPeruPhilippinesPolandPortugalPost-demographic dividendPre-demographic dividendQatarRomaniaRussian FederationRwandaSamoaSan MarinoSao Tome and PrincipeSaudi ArabiaSenegalSerbiaSeychellesSierra LeoneSingaporeSlovak RepublicSloveniaSmall statesSolomon IslandsSouth AfricaSouth AsiaSouth Asia (IDA & IBRD)SpainSri LankaSt. Kitts and NevisSt. LuciaSt. Vincent and the GrenadinesSub-Saharan Africa Sub-Saharan Africa (excluding high income)Sub-Saharan Africa (IDA & IBRD countries)SudanSurinameSwazilandSwedenSwitzerlandSyrian Arab RepublicTajikistanTanzaniaThailandTimor-LesteTogoTongaTrinidad and TobagoTunisiaTurkeyUgandaUkraineUnited Arab EmiratesUpper middle incomeUruguayUzbekistanVanuatuVenezuela, RBVietnamWest Bank and GazaWorldYemen, Rep.ZambiaZimbabwe Timeline:
This timeline shows a graph from 1975 to 2014 of IDA total. No data until 1974. Number of actual observations by date: 40.
Source name:
World Development Indicators
Source organization:
UNESCO Institute for Statistics
Categories, topics:
Education, Gender
Last updated:
apr 23, 2017
Indicators value changes by year
Maximum:
65.767
jan 1, 2006
At the date of observation
Value
Absolute change
Change from previous value
jan 1, 1975
49.895
+49.895
0.0%
jan 1, 1976
49.514
-0.381
-0.76%
jan 1, 1977
49.421
-0.093
-0.19%
jan 1, 1978
48.71
-0.711
-1.44%
jan 1, 1979
49.512
+0.802
1.65%
jan 1, 1980
49.777
+0.265
0.53%
jan 1, 1981
49.671
-0.106
-0.21%
jan 1, 1982
50.162
+0.491
0.99%
jan 1, 1983
51.256
+1.094
2.18%
jan 1, 1984
51.632
+0.376
0.73%
jan 1, 1985
52.365
+0.733
1.42%
jan 1, 1986
52.383
+0.017
0.03%
jan 1, 1987
53.301
+0.919
1.75%
jan 1, 1988
54.04
+0.739
1.39%
jan 1, 1989
54.654
+0.614
1.14%
jan 1, 1990
54.864
+0.21
0.38%
jan 1, 1991
55.779
+0.915
1.67%
jan 1, 1992
56.242
+0.463
0.83%
jan 1, 1993
56.445
+0.204
0.36%
jan 1, 1994
57.248
+0.802
1.42%
jan 1, 1995
56.932
-0.316
-0.55%
jan 1, 1996
57.237
+0.306
0.54%
jan 1, 1997
56.754
-0.483
-0.84%
jan 1, 1998
58.329
+1.575
2.77%
jan 1, 1999
60.928
+2.599
4.46%
jan 1, 2000
62.448
+1.519
2.49%
jan 1, 2001
63.722
+1.275
2.04%
jan 1, 2002
65.361
+1.638
2.57%
jan 1, 2003
64.853
-0.508
-0.78%
jan 1, 2004
64.118
-0.735
-1.13%
jan 1, 2005
65.003
+0.886
1.38%
jan 1, 2006
65.767
+0.764
1.17%
jan 1, 2007
62.382
-3.385
-5.15%
jan 1, 2008
61.105
-1.277
-2.05%
jan 1, 2009
62.975
+1.871
3.06%
jan 1, 2010
62.761
-0.214
-0.34%
jan 1, 2011
61.581
-1.18
-1.88%
jan 1, 2012
63.891
+2.311
3.75%
jan 1, 2013
62.849
-1.042
-1.63%
jan 1, 2014
64.438
+1.588
2.53%
Ranking of countries by current statistics by years


Comments: