29
/
en
AIzaSyAYiBZKx7MnpbEhh9jyipgxe19OcubqV5w
April 1, 2024
265315
Togo
TGO
true
2
1
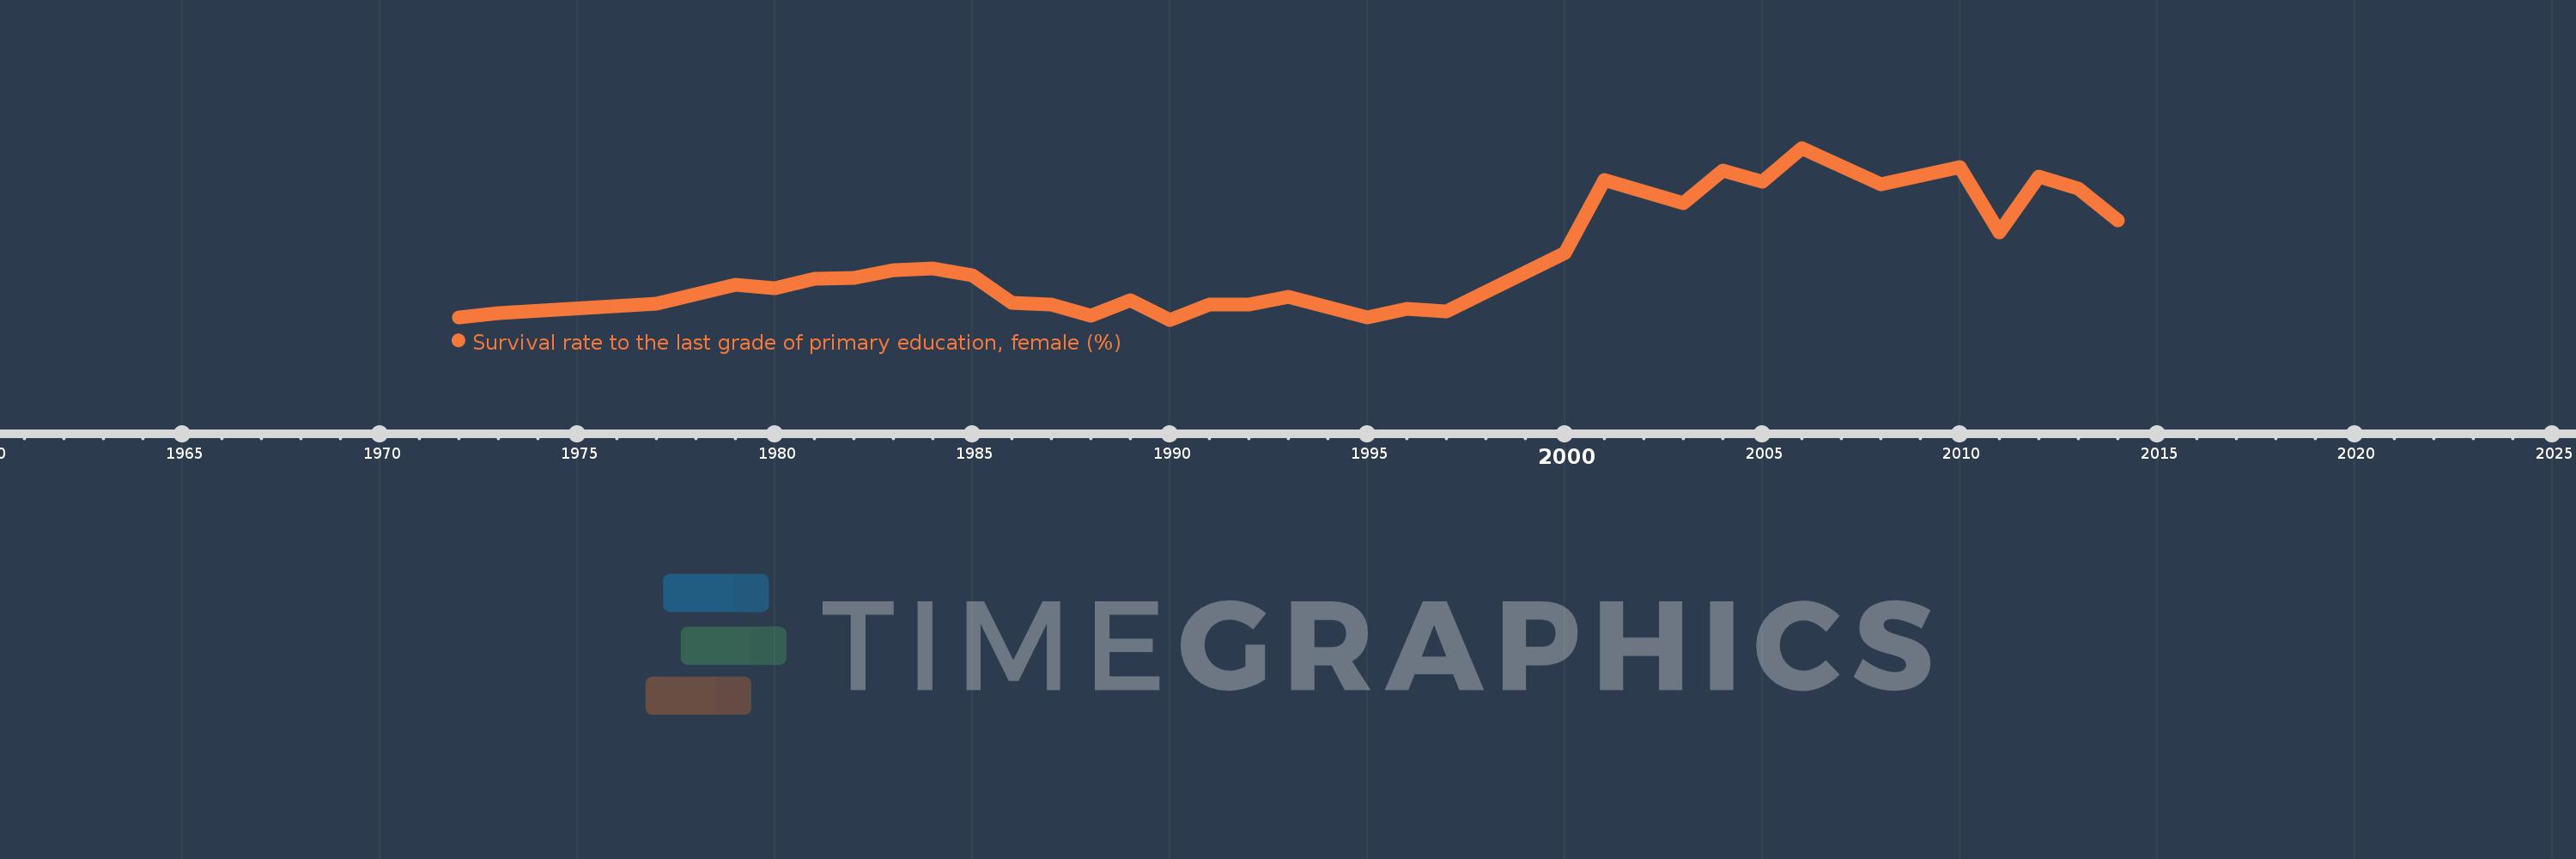
Survival rate to the last grade of primary education, female (%)
2014,2013,2012,2011,2010,2008,2006,2005,2004,2003,2001,2000,1997,1996,1995,1993,1992,1991,1990,1989,1988,1987,1986,1985,1984,1983,1982,1981,1980,1979,1977,1973,1972
This statistics in other country:
AfghanistanAlbaniaAlgeriaAndorraAngolaArab WorldArgentinaArmeniaArubaAustriaAzerbaijanBahamas, TheBahrainBangladeshBarbadosBelarusBelgiumBelizeBeninBermudaBhutanBoliviaBosnia and HerzegovinaBotswanaBrazilBrunei DarussalamBulgariaBurkina FasoBurundiCabo VerdeCambodiaCameroonCanadaCaribbean small statesCentral African RepublicCentral Europe and the BalticsChadChileChinaColombiaComorosCongo, Dem. Rep.Congo, Rep.Costa RicaCote d'IvoireCroatiaCubaCyprusCzech RepublicDenmarkDjiboutiDominicaDominican RepublicEarly-demographic dividendEast Asia & PacificEast Asia & Pacific (excluding high income)East Asia & Pacific (IDA & IBRD countries)EcuadorEgypt, Arab Rep.El SalvadorEquatorial GuineaEritreaEstoniaEthiopiaEuro areaEurope & Central AsiaEurope & Central Asia (excluding high income)Europe & Central Asia (IDA & IBRD countries)European UnionFijiFinlandFragile and conflict affected situationsFranceGabonGambia, TheGeorgiaGermanyGhanaGreeceGuatemalaGuineaGuinea-BissauGuyanaHaitiHeavily indebted poor countries (HIPC)High incomeHondurasHong Kong SAR, ChinaHungaryIBRD onlyIcelandIDA & IBRD totalIDA blendIDA onlyIDA totalIndiaIndonesiaIran, Islamic Rep.IraqIsraelItalyJamaicaJapanJordanKazakhstanKenyaKiribatiKorea, Rep.KuwaitKyrgyz RepublicLao PDRLate-demographic dividendLatin America & Caribbean Latin America & Caribbean (excluding high income)Latin America & the Caribbean (IDA & IBRD countries)LatviaLeast developed countries: UN classificationLebanonLesothoLiberiaLibyaLiechtensteinLithuaniaLow & middle incomeLow incomeLower middle incomeLuxembourgMacao SAR, ChinaMacedonia, FYRMadagascarMalawiMalaysiaMaldivesMaliMaltaMarshall IslandsMauritaniaMauritiusMexicoMiddle East & North AfricaMiddle East & North Africa (excluding high income)Middle East & North Africa (IDA & IBRD countries)Middle incomeMoldovaMongoliaMontenegroMoroccoMozambiqueMyanmarNamibiaNepalNetherlandsNicaraguaNigerNigeriaNorth AmericaNorwayOECD membersOmanOther small statesPacific island small statesPakistanPanamaPapua New GuineaParaguayPeruPhilippinesPolandPortugalPost-demographic dividendPre-demographic dividendQatarRomaniaRussian FederationRwandaSamoaSan MarinoSao Tome and PrincipeSaudi ArabiaSenegalSerbiaSeychellesSierra LeoneSingaporeSlovak RepublicSloveniaSmall statesSolomon IslandsSouth AfricaSouth AsiaSouth Asia (IDA & IBRD)SpainSri LankaSt. Kitts and NevisSt. LuciaSt. Vincent and the GrenadinesSub-Saharan Africa Sub-Saharan Africa (excluding high income)Sub-Saharan Africa (IDA & IBRD countries)SudanSurinameSwazilandSwedenSwitzerlandSyrian Arab RepublicTajikistanTanzaniaThailandTimor-LesteTogoTongaTrinidad and TobagoTunisiaTurkeyUgandaUkraineUnited Arab EmiratesUpper middle incomeUruguayUzbekistanVanuatuVenezuela, RBVietnamWest Bank and GazaWorldYemen, Rep.ZambiaZimbabwe Timeline:
This timeline shows a graph from 1972 to 2014 of Togo. No data until 1971. Number of actual observations by date: 33.
Source name:
World Development Indicators
Source organization:
UNESCO Institute for Statistics
Categories, topics:
Education, Gender
Last updated:
apr 23, 2017
Indicators value changes by year
Minimum:
21.841
jan 1, 1990
Maximum:
72.725
jan 1, 2006
At the date of observation
Value
Absolute change
Change from previous value
jan 1, 1972
22.47
+22.47
0.0%
jan 1, 1973
23.677
+1.207
5.37%
jan 1, 1977
26.519
+2.842
12.0%
jan 1, 1979
32.18
+5.66
21.34%
jan 1, 1980
31.214
-0.966
-3.0%
jan 1, 1981
33.901
+2.687
8.61%
jan 1, 1982
34.143
+0.242
0.71%
jan 1, 1983
36.626
+2.483
7.27%
jan 1, 1984
37.142
+0.516
1.41%
jan 1, 1985
35.035
-2.108
-5.67%
jan 1, 1986
26.803
-8.232
-23.5%
jan 1, 1987
26.257
-0.545
-2.03%
jan 1, 1988
22.965
-3.292
-12.54%
jan 1, 1989
27.713
+4.749
20.68%
jan 1, 1990
21.841
-5.873
-21.19%
jan 1, 1991
26.389
+4.548
20.83%
jan 1, 1992
26.266
-0.123
-0.46%
jan 1, 1993
28.569
+2.303
8.77%
jan 1, 1995
22.525
-6.045
-21.16%
jan 1, 1996
24.986
+2.461
10.93%
jan 1, 1997
24.22
-0.767
-3.07%
jan 1, 2000
41.619
+17.4
71.84%
jan 1, 2001
63.126
+21.506
51.67%
jan 1, 2003
56.249
-6.877
-10.89%
jan 1, 2004
66.078
+9.83
17.48%
jan 1, 2005
62.784
-3.295
-4.99%
jan 1, 2006
72.725
+9.942
15.84%
jan 1, 2008
61.998
-10.728
-14.75%
jan 1, 2010
67.171
+5.173
8.34%
jan 1, 2011
47.737
-19.434
-28.93%
jan 1, 2012
64.199
+16.462
34.48%
jan 1, 2013
60.674
-3.525
-5.49%
jan 1, 2014
51.373
-9.301
-15.33%
Ranking of countries by current statistics by years


Comments: