29
/
en
AIzaSyAYiBZKx7MnpbEhh9jyipgxe19OcubqV5w
April 1, 2024
178323
Lesotho
LSO
true
2
1
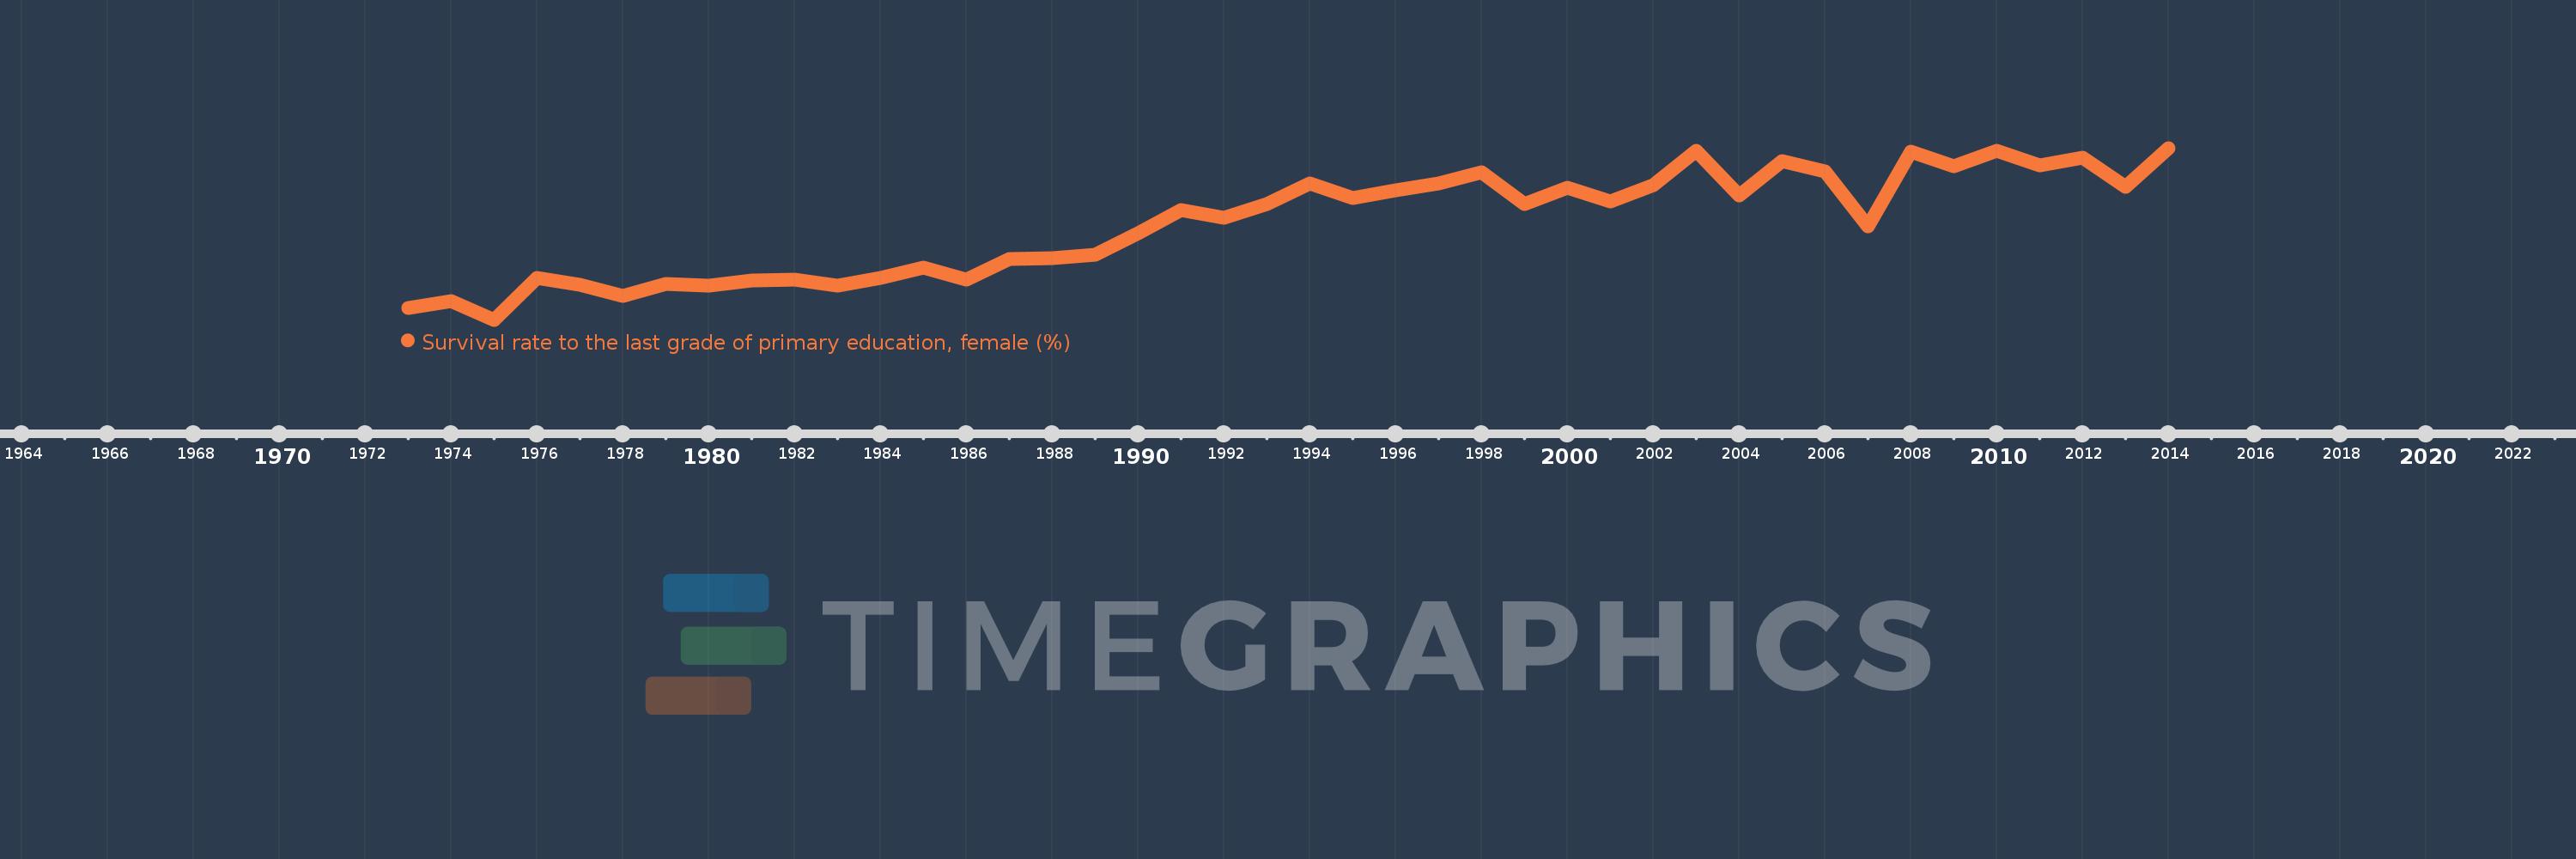
Survival rate to the last grade of primary education, female (%)
2014,2013,2012,2011,2010,2009,2008,2007,2006,2005,2004,2003,2002,2001,2000,1999,1998,1997,1996,1995,1994,1993,1992,1991,1990,1989,1988,1987,1986,1985,1984,1983,1982,1981,1980,1979,1978,1977,1976,1975,1974,1973
This statistics in other country:
AfghanistanAlbaniaAlgeriaAndorraAngolaArab WorldArgentinaArmeniaArubaAustriaAzerbaijanBahamas, TheBahrainBangladeshBarbadosBelarusBelgiumBelizeBeninBermudaBhutanBoliviaBosnia and HerzegovinaBotswanaBrazilBrunei DarussalamBulgariaBurkina FasoBurundiCabo VerdeCambodiaCameroonCanadaCaribbean small statesCentral African RepublicCentral Europe and the BalticsChadChileChinaColombiaComorosCongo, Dem. Rep.Congo, Rep.Costa RicaCote d'IvoireCroatiaCubaCyprusCzech RepublicDenmarkDjiboutiDominicaDominican RepublicEarly-demographic dividendEast Asia & PacificEast Asia & Pacific (excluding high income)East Asia & Pacific (IDA & IBRD countries)EcuadorEgypt, Arab Rep.El SalvadorEquatorial GuineaEritreaEstoniaEthiopiaEuro areaEurope & Central AsiaEurope & Central Asia (excluding high income)Europe & Central Asia (IDA & IBRD countries)European UnionFijiFinlandFragile and conflict affected situationsFranceGabonGambia, TheGeorgiaGermanyGhanaGreeceGuatemalaGuineaGuinea-BissauGuyanaHaitiHeavily indebted poor countries (HIPC)High incomeHondurasHong Kong SAR, ChinaHungaryIBRD onlyIcelandIDA & IBRD totalIDA blendIDA onlyIDA totalIndiaIndonesiaIran, Islamic Rep.IraqIsraelItalyJamaicaJapanJordanKazakhstanKenyaKiribatiKorea, Rep.KuwaitKyrgyz RepublicLao PDRLate-demographic dividendLatin America & Caribbean Latin America & Caribbean (excluding high income)Latin America & the Caribbean (IDA & IBRD countries)LatviaLeast developed countries: UN classificationLebanonLesothoLiberiaLibyaLiechtensteinLithuaniaLow & middle incomeLow incomeLower middle incomeLuxembourgMacao SAR, ChinaMacedonia, FYRMadagascarMalawiMalaysiaMaldivesMaliMaltaMarshall IslandsMauritaniaMauritiusMexicoMiddle East & North AfricaMiddle East & North Africa (excluding high income)Middle East & North Africa (IDA & IBRD countries)Middle incomeMoldovaMongoliaMontenegroMoroccoMozambiqueMyanmarNamibiaNepalNetherlandsNicaraguaNigerNigeriaNorth AmericaNorwayOECD membersOmanOther small statesPacific island small statesPakistanPanamaPapua New GuineaParaguayPeruPhilippinesPolandPortugalPost-demographic dividendPre-demographic dividendQatarRomaniaRussian FederationRwandaSamoaSan MarinoSao Tome and PrincipeSaudi ArabiaSenegalSerbiaSeychellesSierra LeoneSingaporeSlovak RepublicSloveniaSmall statesSolomon IslandsSouth AfricaSouth AsiaSouth Asia (IDA & IBRD)SpainSri LankaSt. Kitts and NevisSt. LuciaSt. Vincent and the GrenadinesSub-Saharan Africa Sub-Saharan Africa (excluding high income)Sub-Saharan Africa (IDA & IBRD countries)SudanSurinameSwazilandSwedenSwitzerlandSyrian Arab RepublicTajikistanTanzaniaThailandTimor-LesteTogoTongaTrinidad and TobagoTunisiaTurkeyUgandaUkraineUnited Arab EmiratesUpper middle incomeUruguayUzbekistanVanuatuVenezuela, RBVietnamWest Bank and GazaWorldYemen, Rep.ZambiaZimbabwe Timeline:
This timeline shows a graph from 1973 to 2014 of Lesotho. No data until 1972. Number of actual observations by date: 42.
Source name:
World Development Indicators
Source organization:
UNESCO Institute for Statistics
Categories, topics:
Education, Gender
Last updated:
apr 23, 2017
Indicators value changes by year
Minimum:
30.108
jan 1, 1975
Maximum:
77.679
jan 1, 2014
At the date of observation
Value
Absolute change
Change from previous value
jan 1, 1973
33.396
+33.396
0.0%
jan 1, 1974
35.161
+1.765
5.28%
jan 1, 1975
30.108
-5.053
-14.37%
jan 1, 1976
41.668
+11.559
38.39%
jan 1, 1977
39.793
-1.875
-4.5%
jan 1, 1978
36.602
-3.191
-8.02%
jan 1, 1979
40.065
+3.463
9.46%
jan 1, 1980
39.53
-0.535
-1.34%
jan 1, 1981
40.898
+1.368
3.46%
jan 1, 1982
41.175
+0.276
0.68%
jan 1, 1983
39.441
-1.734
-4.21%
jan 1, 1984
41.706
+2.265
5.74%
jan 1, 1985
44.497
+2.791
6.69%
jan 1, 1986
41.189
-3.308
-7.43%
jan 1, 1987
47.0
+5.811
14.11%
jan 1, 1988
47.21
+0.21
0.45%
jan 1, 1989
48.214
+1.004
2.13%
jan 1, 1990
54.028
+5.815
12.06%
jan 1, 1991
60.465
+6.436
11.91%
jan 1, 1992
58.267
-2.198
-3.63%
jan 1, 1993
62.065
+3.798
6.52%
jan 1, 1994
67.824
+5.76
9.28%
jan 1, 1995
63.735
-4.089
-6.03%
jan 1, 1996
65.903
+2.168
3.4%
jan 1, 1997
67.828
+1.925
2.92%
jan 1, 1998
70.874
+3.046
4.49%
jan 1, 1999
62.085
-8.789
-12.4%
jan 1, 2000
66.604
+4.519
7.28%
jan 1, 2001
62.901
-3.703
-5.56%
jan 1, 2002
67.402
+4.501
7.16%
jan 1, 2003
76.795
+9.393
13.94%
jan 1, 2004
64.481
-12.314
-16.04%
jan 1, 2005
74.002
+9.521
14.77%
jan 1, 2006
71.234
-2.767
-3.74%
jan 1, 2007
55.902
-15.332
-21.52%
jan 1, 2008
76.653
+20.751
37.12%
jan 1, 2009
72.687
-3.966
-5.17%
jan 1, 2010
76.817
+4.129
5.68%
jan 1, 2011
72.747
-4.07
-5.3%
jan 1, 2012
75.075
+2.328
3.2%
jan 1, 2013
66.897
-8.178
-10.89%
jan 1, 2014
77.679
+10.782
16.12%
Ranking of countries by current statistics by years


Comments: