29
/
en
AIzaSyAYiBZKx7MnpbEhh9jyipgxe19OcubqV5w
April 1, 2024
45154
Low & middle income
LMY
false
2
1
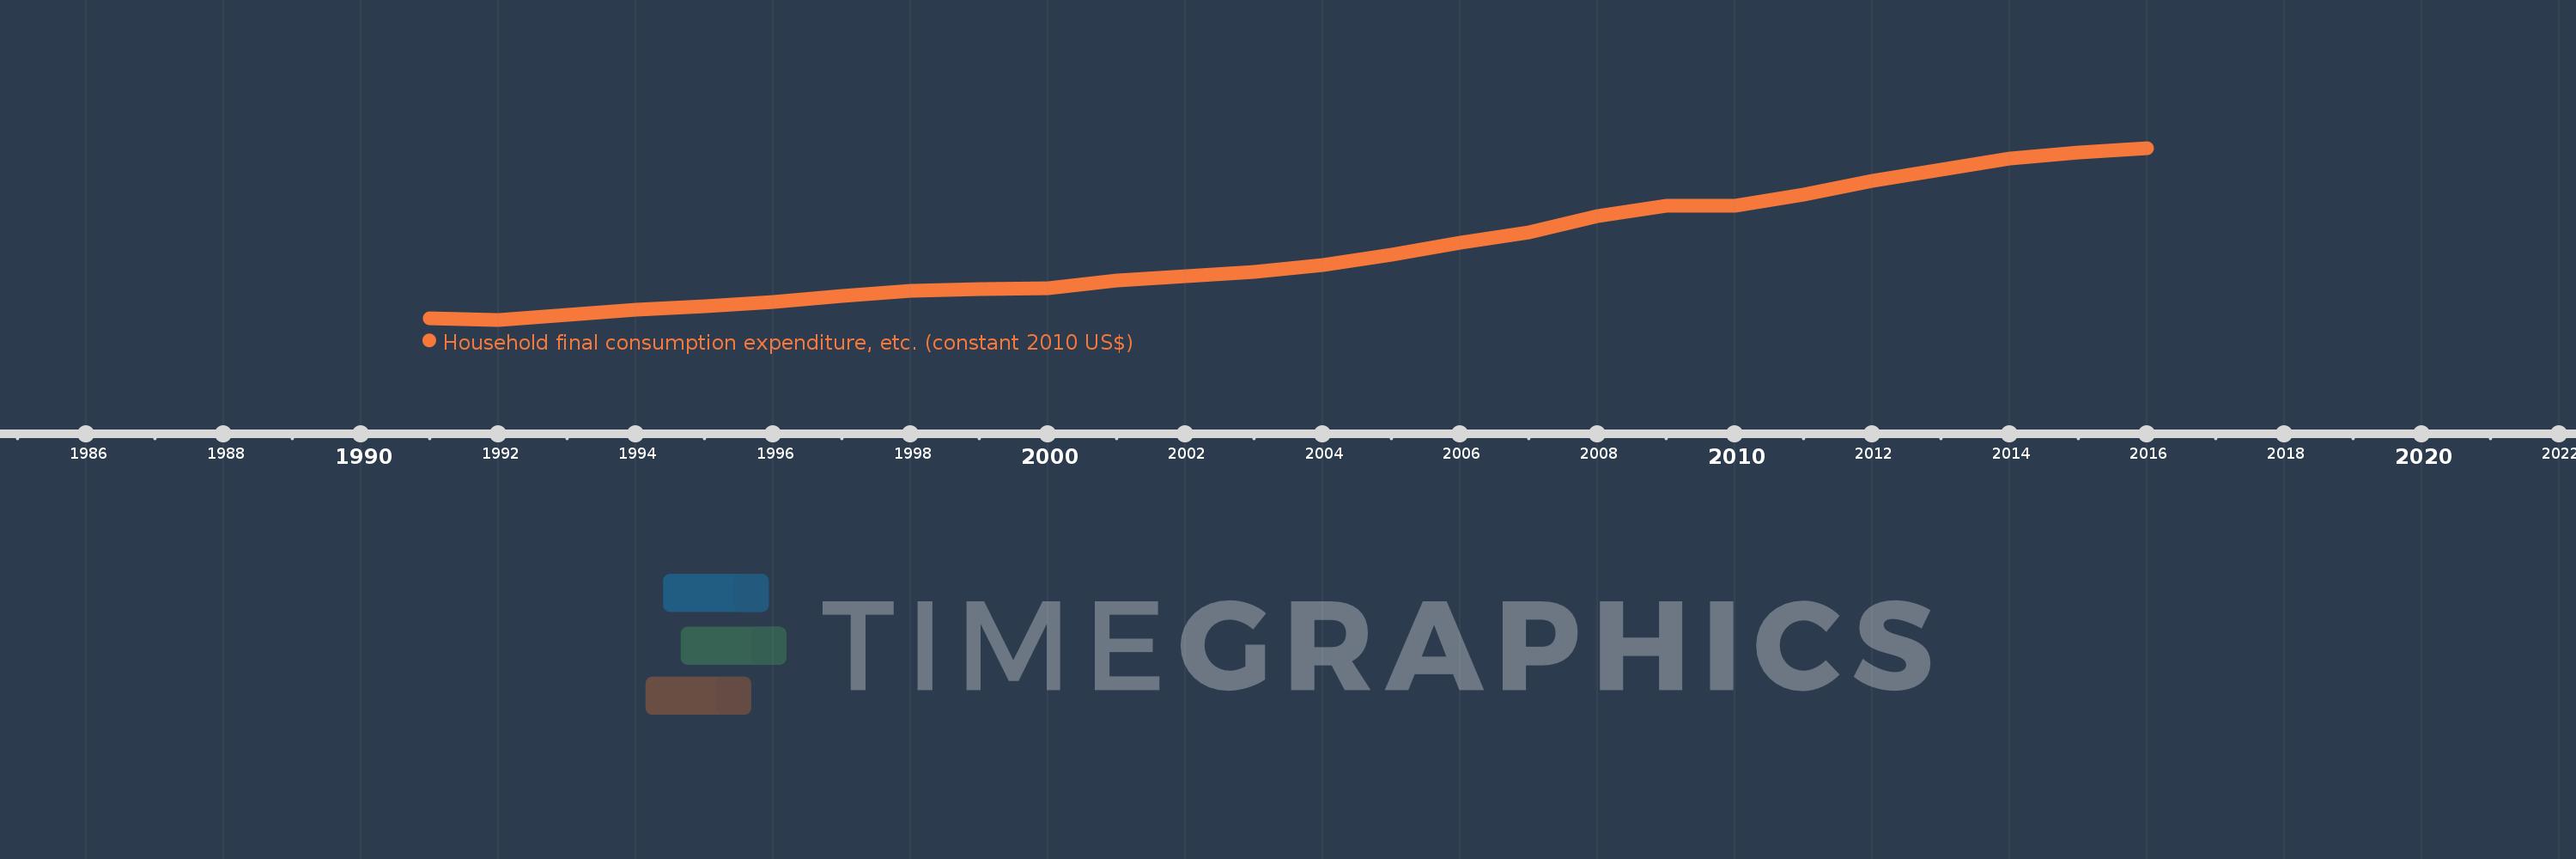
Household final consumption expenditure, etc. (constant 2010 US$)
2016,2015,2014,2013,2012,2011,2010,2009,2008,2007,2006,2005,2004,2003,2002,2001,2000,1999,1998,1997,1996,1995,1994,1993,1992,1991
This statistics in other country:
AfghanistanAlbaniaAlgeriaAngolaAntigua and BarbudaArab WorldArgentinaArmeniaArubaAustraliaAustriaAzerbaijanBahamas, TheBahrainBangladeshBarbadosBelarusBelgiumBelizeBeninBermudaBhutanBoliviaBosnia and HerzegovinaBotswanaBrazilBrunei DarussalamBulgariaBurkina FasoBurundiCabo VerdeCambodiaCameroonCanadaCaribbean small statesCentral African RepublicCentral Europe and the BalticsChadChileChinaColombiaComorosCongo, Dem. Rep.Congo, Rep.Cote d'IvoireCroatiaCubaCyprusCzech RepublicDenmarkDominicaDominican RepublicEarly-demographic dividendEast Asia & PacificEast Asia & Pacific (excluding high income)East Asia & Pacific (IDA & IBRD countries)EcuadorEgypt, Arab Rep.El SalvadorEquatorial GuineaEritreaEstoniaEuro areaEurope & Central AsiaEurope & Central Asia (excluding high income)Europe & Central Asia (IDA & IBRD countries)European UnionFaroe IslandsFinlandFragile and conflict affected situationsFranceGabonGambia, TheGeorgiaGermanyGhanaGreeceGrenadaGuatemalaGuineaGuinea-BissauGuyanaHaitiHeavily indebted poor countries (HIPC)High incomeHondurasHong Kong SAR, ChinaHungaryIBRD onlyIcelandIDA & IBRD totalIDA blendIDA onlyIDA totalIndiaIndonesiaIran, Islamic Rep.IraqIrelandIsraelItalyJamaicaJapanJordanKazakhstanKenyaKorea, Rep.KosovoKuwaitKyrgyz RepublicLao PDRLate-demographic dividendLatin America & Caribbean Latin America & Caribbean (excluding high income)Latin America & the Caribbean (IDA & IBRD countries)LatviaLeast developed countries: UN classificationLebanonLiberiaLithuaniaLow & middle incomeLow incomeLower middle incomeLuxembourgMacao SAR, ChinaMacedonia, FYRMadagascarMalawiMalaysiaMaliMaltaMauritaniaMauritiusMexicoMiddle East & North AfricaMiddle East & North Africa (excluding high income)Middle East & North Africa (IDA & IBRD countries)Middle incomeMoldovaMongoliaMontenegroMoroccoMozambiqueNamibiaNepalNetherlandsNew ZealandNicaraguaNigerNigeriaNorth AmericaNorwayOECD membersOmanOther small statesPakistanPanamaParaguayPeruPhilippinesPolandPortugalPost-demographic dividendPre-demographic dividendPuerto RicoQatarRomaniaRussian FederationRwandaSaudi ArabiaSenegalSerbiaSeychellesSierra LeoneSingaporeSlovak RepublicSloveniaSmall statesSouth AfricaSouth AsiaSouth Asia (IDA & IBRD)South SudanSpainSri LankaSt. Kitts and NevisSt. LuciaSt. Vincent and the GrenadinesSub-Saharan Africa Sub-Saharan Africa (excluding high income)Sub-Saharan Africa (IDA & IBRD countries)SudanSurinameSwazilandSwedenSwitzerlandTajikistanTanzaniaThailandTimor-LesteTogoTongaTrinidad and TobagoTunisiaTurkeyTurkmenistanUgandaUkraineUnited Arab EmiratesUnited KingdomUnited StatesUpper middle incomeUruguayUzbekistanVanuatuVenezuela, RBVietnamWest Bank and GazaWorldYemen, Rep.ZambiaZimbabwe Timeline:
This timeline shows a graph from 1991 to 2016 of Low & middle income. No data until 1990. Number of actual observations by date: 26.
Source name:
World Development Indicators
Source organization:
World Bank national accounts data, and OECD National Accounts data files.
Categories, topics:
Economy & Growth
Last updated:
apr 23, 2017
Indicators value changes by year
Minimum:
5.13 trl
jan 1, 1992
Maximum:
13.007 trl
jan 1, 2016
At the date of observation
Value
Absolute change
Change from previous value
jan 1, 1991
5.18 trl
+5.18 trl
0.0%
jan 1, 1992
5.13 trl
-50.439 bln
-0.97%
jan 1, 1993
5.359 trl
+228.733 bln
4.46%
jan 1, 1994
5.609 trl
+250.748 bln
4.68%
jan 1, 1995
5.73 trl
+120.988 bln
2.16%
jan 1, 1996
5.929 trl
+199.001 bln
3.47%
jan 1, 1997
6.21 trl
+280.341 bln
4.73%
jan 1, 1998
6.462 trl
+252.117 bln
4.06%
jan 1, 1999
6.542 trl
+79.937 bln
1.24%
jan 1, 2000
6.579 trl
+37.427 bln
0.57%
jan 1, 2001
6.946 trl
+367.129 bln
5.58%
jan 1, 2002
7.116 trl
+169.934 bln
2.45%
jan 1, 2003
7.339 trl
+222.912 bln
3.13%
jan 1, 2004
7.626 trl
+286.72 bln
3.91%
jan 1, 2005
8.092 trl
+466.368 bln
6.12%
jan 1, 2006
8.657 trl
+564.328 bln
6.97%
jan 1, 2007
9.116 trl
+459.753 bln
5.31%
jan 1, 2008
9.895 trl
+778.903 bln
8.54%
jan 1, 2009
10.348 trl
+453.228 bln
4.58%
jan 1, 2010
10.347 trl
-1.53 bln
-0.01%
jan 1, 2011
10.85 trl
+503.309 bln
4.86%
jan 1, 2012
11.488 trl
+637.639 bln
5.88%
jan 1, 2013
12.0 trl
+512.466 bln
4.46%
jan 1, 2014
12.521 trl
+520.57 bln
4.34%
jan 1, 2015
12.805 trl
+284.558 bln
2.27%
jan 1, 2016
13.007 trl
+201.673 bln
1.57%
Ranking of countries by current statistics by years


Comments: