29
/
en
AIzaSyAYiBZKx7MnpbEhh9jyipgxe19OcubqV5w
April 1, 2024
38228
IDA blend
IDB
false
2
1
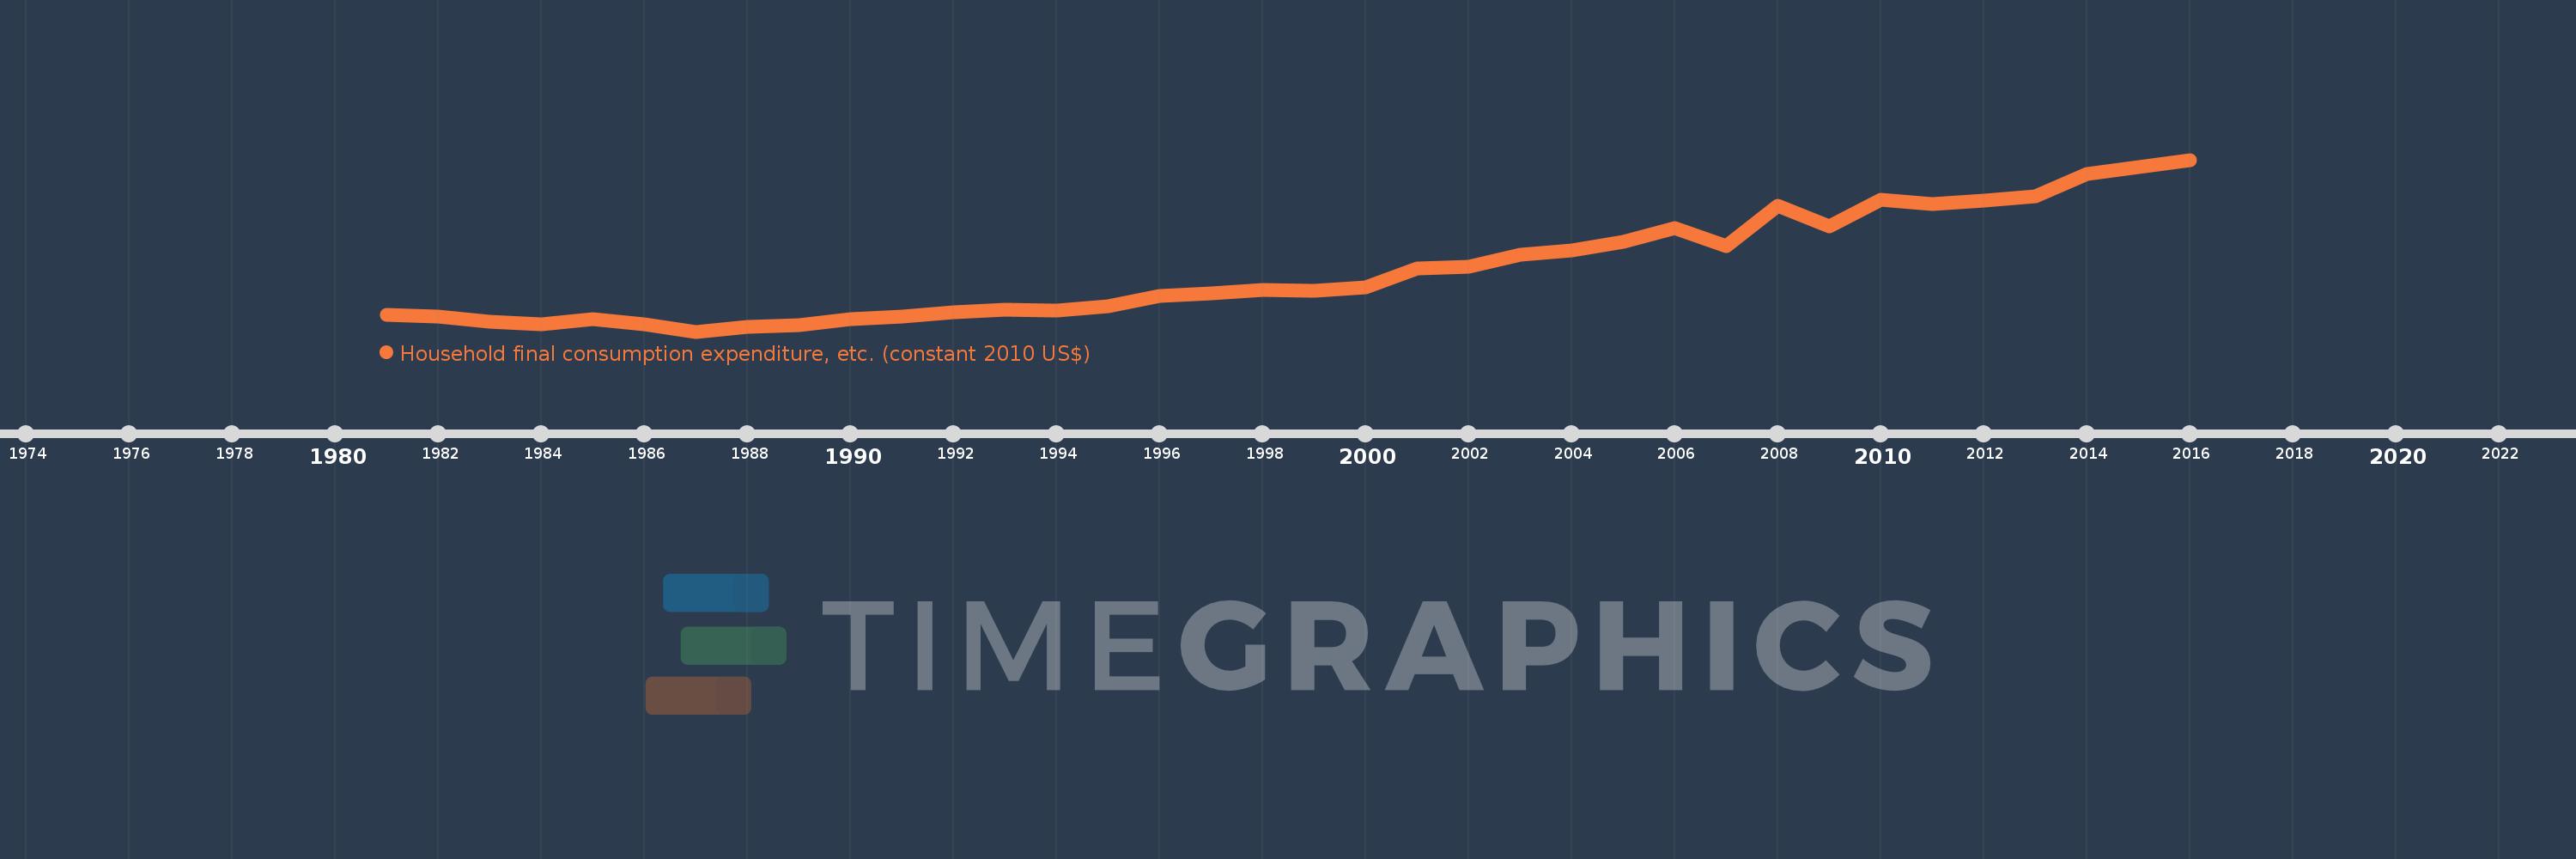
Household final consumption expenditure, etc. (constant 2010 US$)
2016,2015,2014,2013,2012,2011,2010,2009,2008,2007,2006,2005,2004,2003,2002,2001,2000,1999,1998,1997,1996,1995,1994,1993,1992,1991,1990,1989,1988,1987,1986,1985,1984,1983,1982,1981
This statistics in other country:
AfghanistanAlbaniaAlgeriaAngolaAntigua and BarbudaArab WorldArgentinaArmeniaArubaAustraliaAustriaAzerbaijanBahamas, TheBahrainBangladeshBarbadosBelarusBelgiumBelizeBeninBermudaBhutanBoliviaBosnia and HerzegovinaBotswanaBrazilBrunei DarussalamBulgariaBurkina FasoBurundiCabo VerdeCambodiaCameroonCanadaCaribbean small statesCentral African RepublicCentral Europe and the BalticsChadChileChinaColombiaComorosCongo, Dem. Rep.Congo, Rep.Cote d'IvoireCroatiaCubaCyprusCzech RepublicDenmarkDominicaDominican RepublicEarly-demographic dividendEast Asia & PacificEast Asia & Pacific (excluding high income)East Asia & Pacific (IDA & IBRD countries)EcuadorEgypt, Arab Rep.El SalvadorEquatorial GuineaEritreaEstoniaEuro areaEurope & Central AsiaEurope & Central Asia (excluding high income)Europe & Central Asia (IDA & IBRD countries)European UnionFaroe IslandsFinlandFragile and conflict affected situationsFranceGabonGambia, TheGeorgiaGermanyGhanaGreeceGrenadaGuatemalaGuineaGuinea-BissauGuyanaHaitiHeavily indebted poor countries (HIPC)High incomeHondurasHong Kong SAR, ChinaHungaryIBRD onlyIcelandIDA & IBRD totalIDA blendIDA onlyIDA totalIndiaIndonesiaIran, Islamic Rep.IraqIrelandIsraelItalyJamaicaJapanJordanKazakhstanKenyaKorea, Rep.KosovoKuwaitKyrgyz RepublicLao PDRLate-demographic dividendLatin America & Caribbean Latin America & Caribbean (excluding high income)Latin America & the Caribbean (IDA & IBRD countries)LatviaLeast developed countries: UN classificationLebanonLiberiaLithuaniaLow & middle incomeLow incomeLower middle incomeLuxembourgMacao SAR, ChinaMacedonia, FYRMadagascarMalawiMalaysiaMaliMaltaMauritaniaMauritiusMexicoMiddle East & North AfricaMiddle East & North Africa (excluding high income)Middle East & North Africa (IDA & IBRD countries)Middle incomeMoldovaMongoliaMontenegroMoroccoMozambiqueNamibiaNepalNetherlandsNew ZealandNicaraguaNigerNigeriaNorth AmericaNorwayOECD membersOmanOther small statesPakistanPanamaParaguayPeruPhilippinesPolandPortugalPost-demographic dividendPre-demographic dividendPuerto RicoQatarRomaniaRussian FederationRwandaSaudi ArabiaSenegalSerbiaSeychellesSierra LeoneSingaporeSlovak RepublicSloveniaSmall statesSouth AfricaSouth AsiaSouth Asia (IDA & IBRD)South SudanSpainSri LankaSt. Kitts and NevisSt. LuciaSt. Vincent and the GrenadinesSub-Saharan Africa Sub-Saharan Africa (excluding high income)Sub-Saharan Africa (IDA & IBRD countries)SudanSurinameSwazilandSwedenSwitzerlandTajikistanTanzaniaThailandTimor-LesteTogoTongaTrinidad and TobagoTunisiaTurkeyTurkmenistanUgandaUkraineUnited Arab EmiratesUnited KingdomUnited StatesUpper middle incomeUruguayUzbekistanVanuatuVenezuela, RBVietnamWest Bank and GazaWorldYemen, Rep.ZambiaZimbabwe Timeline:
This timeline shows a graph from 1981 to 2016 of IDA blend. No data until 1980. Number of actual observations by date: 36.
Source name:
World Development Indicators
Source organization:
World Bank national accounts data, and OECD National Accounts data files.
Categories, topics:
Economy & Growth
Last updated:
apr 23, 2017
Indicators value changes by year
Minimum:
195.965 bln
jan 1, 1987
Maximum:
722.794 bln
jan 1, 2016
At the date of observation
Value
Absolute change
Change from previous value
jan 1, 1981
247.78 bln
+247.78 bln
0.0%
jan 1, 1982
242.86 bln
-4.92 bln
-1.99%
jan 1, 1983
226.686 bln
-16.173 bln
-6.66%
jan 1, 1984
219.242 bln
-7.445 bln
-3.28%
jan 1, 1985
235.238 bln
+15.996 bln
7.3%
jan 1, 1986
217.252 bln
-17.986 bln
-7.65%
jan 1, 1987
195.965 bln
-21.287 bln
-9.8%
jan 1, 1988
211.137 bln
+15.172 bln
7.74%
jan 1, 1989
214.617 bln
+3.48 bln
1.65%
jan 1, 1990
235.199 bln
+20.582 bln
9.59%
jan 1, 1991
241.03 bln
+5.831 bln
2.48%
jan 1, 1992
255.176 bln
+14.146 bln
5.87%
jan 1, 1993
263.017 bln
+7.84 bln
3.07%
jan 1, 1994
261.266 bln
-1.751 bln
-0.67%
jan 1, 1995
272.501 bln
+11.235 bln
4.3%
jan 1, 1996
306.353 bln
+33.852 bln
12.42%
jan 1, 1997
312.186 bln
+5.833 bln
1.9%
jan 1, 1998
322.562 bln
+10.376 bln
3.32%
jan 1, 1999
320.095 bln
-2.467 bln
-0.76%
jan 1, 2000
332.466 bln
+12.371 bln
3.86%
jan 1, 2001
390.504 bln
+58.038 bln
17.46%
jan 1, 2002
395.817 bln
+5.313 bln
1.36%
jan 1, 2003
431.202 bln
+35.385 bln
8.94%
jan 1, 2004
444.278 bln
+13.076 bln
3.03%
jan 1, 2005
470.696 bln
+26.418 bln
5.95%
jan 1, 2006
512.476 bln
+41.78 bln
8.88%
jan 1, 2007
456.948 bln
-55.529 bln
-10.84%
jan 1, 2008
581.056 bln
+124.108 bln
27.16%
jan 1, 2009
519.9 bln
-61.156 bln
-10.52%
jan 1, 2010
600.156 bln
+80.256 bln
15.44%
jan 1, 2011
587.235 bln
-12.921 bln
-2.15%
jan 1, 2012
598.476 bln
+11.24 bln
1.91%
jan 1, 2013
610.8 bln
+12.324 bln
2.06%
jan 1, 2014
678.899 bln
+68.099 bln
11.15%
jan 1, 2015
700.151 bln
+21.252 bln
3.13%
jan 1, 2016
722.794 bln
+22.643 bln
3.23%
Ranking of countries by current statistics by years


Comments: