29
/
en
AIzaSyAYiBZKx7MnpbEhh9jyipgxe19OcubqV5w
April 1, 2024
183019
Macao SAR, China
MAC
true
2
1
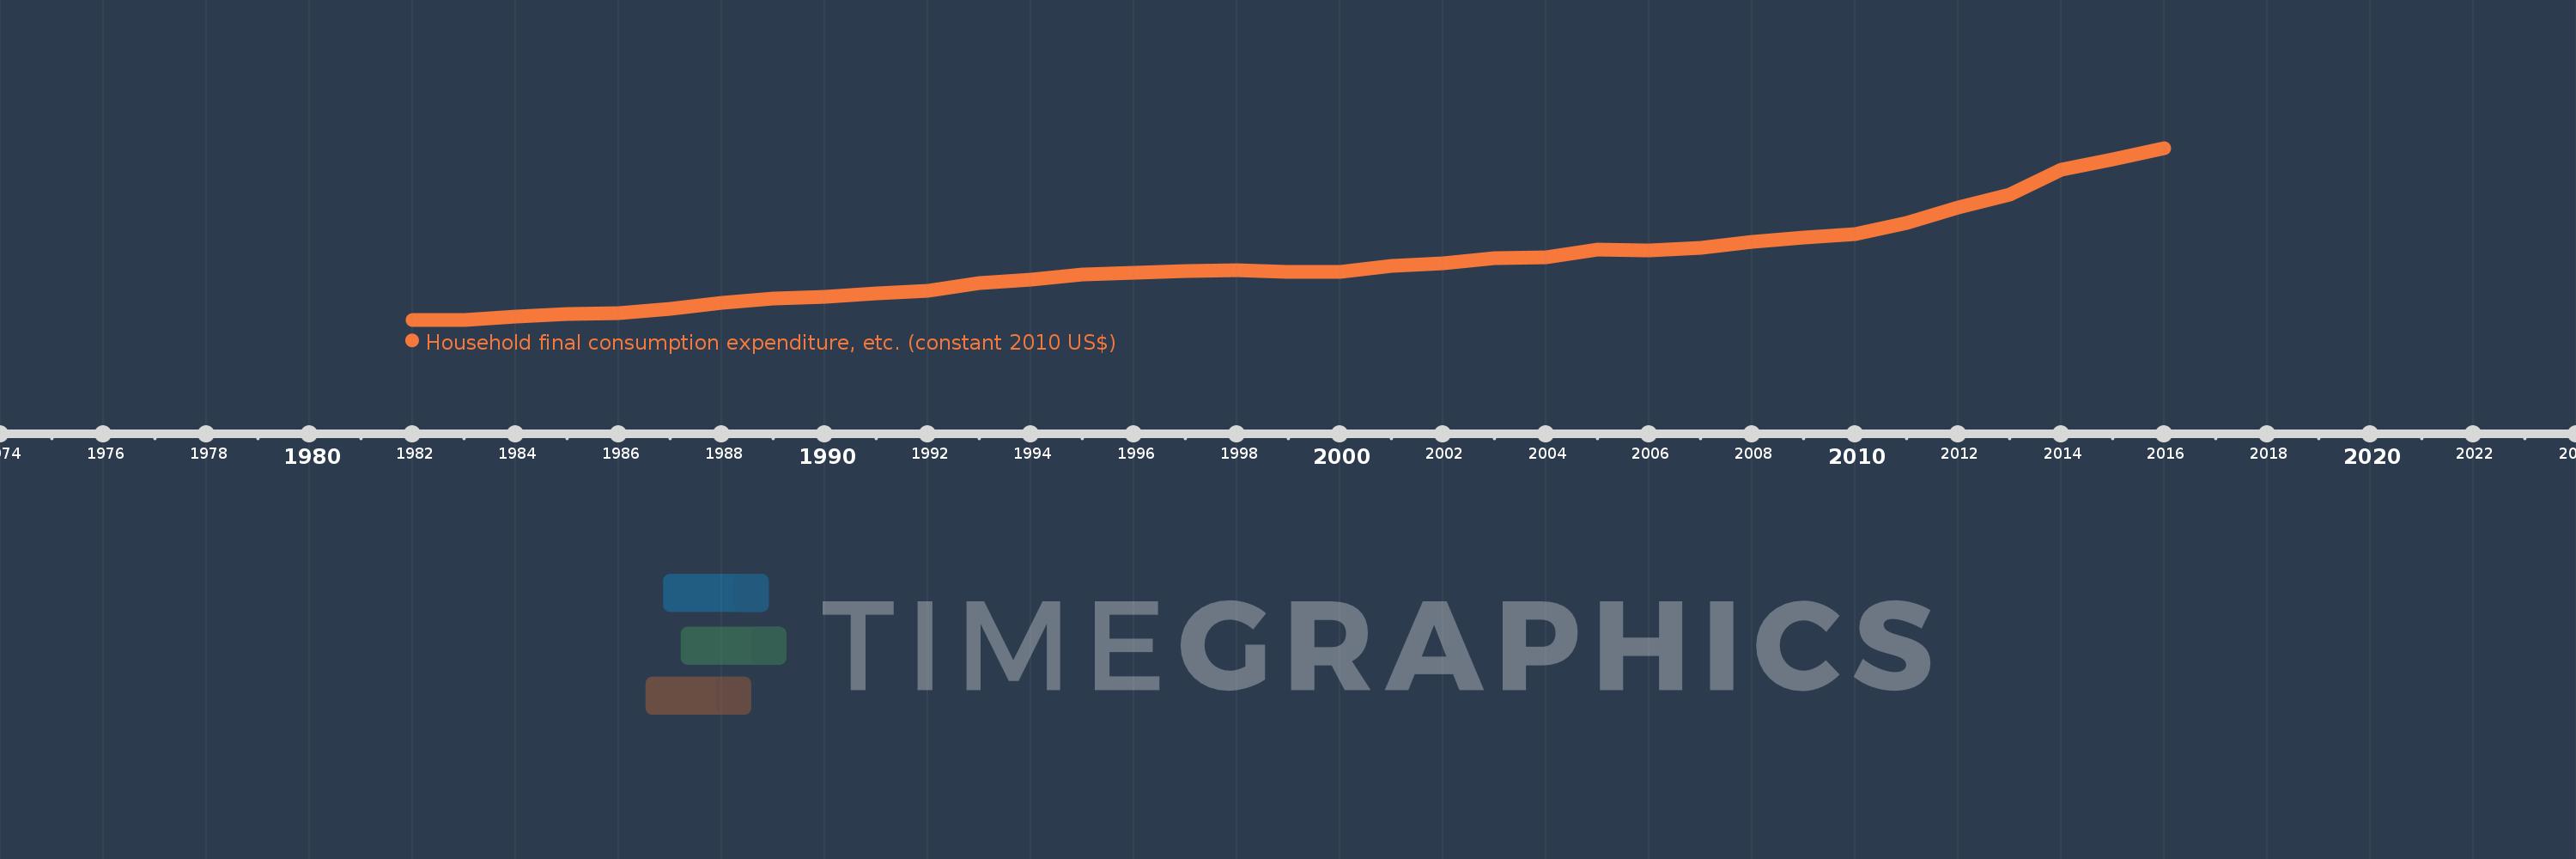
Household final consumption expenditure, etc. (constant 2010 US$)
2016,2015,2014,2013,2012,2011,2010,2009,2008,2007,2006,2005,2004,2003,2002,2001,2000,1999,1998,1997,1996,1995,1994,1993,1992,1991,1990,1989,1988,1987,1986,1985,1984,1983,1982
This statistics in other country:
AfghanistanAlbaniaAlgeriaAngolaAntigua and BarbudaArab WorldArgentinaArmeniaArubaAustraliaAustriaAzerbaijanBahamas, TheBahrainBangladeshBarbadosBelarusBelgiumBelizeBeninBermudaBhutanBoliviaBosnia and HerzegovinaBotswanaBrazilBrunei DarussalamBulgariaBurkina FasoBurundiCabo VerdeCambodiaCameroonCanadaCaribbean small statesCentral African RepublicCentral Europe and the BalticsChadChileChinaColombiaComorosCongo, Dem. Rep.Congo, Rep.Cote d'IvoireCroatiaCubaCyprusCzech RepublicDenmarkDominicaDominican RepublicEarly-demographic dividendEast Asia & PacificEast Asia & Pacific (excluding high income)East Asia & Pacific (IDA & IBRD countries)EcuadorEgypt, Arab Rep.El SalvadorEquatorial GuineaEritreaEstoniaEuro areaEurope & Central AsiaEurope & Central Asia (excluding high income)Europe & Central Asia (IDA & IBRD countries)European UnionFaroe IslandsFinlandFragile and conflict affected situationsFranceGabonGambia, TheGeorgiaGermanyGhanaGreeceGrenadaGuatemalaGuineaGuinea-BissauGuyanaHaitiHeavily indebted poor countries (HIPC)High incomeHondurasHong Kong SAR, ChinaHungaryIBRD onlyIcelandIDA & IBRD totalIDA blendIDA onlyIDA totalIndiaIndonesiaIran, Islamic Rep.IraqIrelandIsraelItalyJamaicaJapanJordanKazakhstanKenyaKorea, Rep.KosovoKuwaitKyrgyz RepublicLao PDRLate-demographic dividendLatin America & Caribbean Latin America & Caribbean (excluding high income)Latin America & the Caribbean (IDA & IBRD countries)LatviaLeast developed countries: UN classificationLebanonLiberiaLithuaniaLow & middle incomeLow incomeLower middle incomeLuxembourgMacao SAR, ChinaMacedonia, FYRMadagascarMalawiMalaysiaMaliMaltaMauritaniaMauritiusMexicoMiddle East & North AfricaMiddle East & North Africa (excluding high income)Middle East & North Africa (IDA & IBRD countries)Middle incomeMoldovaMongoliaMontenegroMoroccoMozambiqueNamibiaNepalNetherlandsNew ZealandNicaraguaNigerNigeriaNorth AmericaNorwayOECD membersOmanOther small statesPakistanPanamaParaguayPeruPhilippinesPolandPortugalPost-demographic dividendPre-demographic dividendPuerto RicoQatarRomaniaRussian FederationRwandaSaudi ArabiaSenegalSerbiaSeychellesSierra LeoneSingaporeSlovak RepublicSloveniaSmall statesSouth AfricaSouth AsiaSouth Asia (IDA & IBRD)South SudanSpainSri LankaSt. Kitts and NevisSt. LuciaSt. Vincent and the GrenadinesSub-Saharan Africa Sub-Saharan Africa (excluding high income)Sub-Saharan Africa (IDA & IBRD countries)SudanSurinameSwazilandSwedenSwitzerlandTajikistanTanzaniaThailandTimor-LesteTogoTongaTrinidad and TobagoTunisiaTurkeyTurkmenistanUgandaUkraineUnited Arab EmiratesUnited KingdomUnited StatesUpper middle incomeUruguayUzbekistanVanuatuVenezuela, RBVietnamWest Bank and GazaWorldYemen, Rep.ZambiaZimbabwe Timeline:
This timeline shows a graph from 1982 to 2016 of Macao SAR, China. No data until 1981. Number of actual observations by date: 35.
Source name:
World Development Indicators
Source organization:
World Bank national accounts data, and OECD National Accounts data files.
Categories, topics:
Economy & Growth
Last updated:
apr 23, 2017
Indicators value changes by year
Minimum:
1.929 bln
jan 1, 1982
Maximum:
10.15 bln
jan 1, 2016
At the date of observation
Value
Absolute change
Change from previous value
jan 1, 1982
1.929 bln
+1.929 bln
0.0%
jan 1, 1983
1.929 bln
0.0
0.0%
jan 1, 1984
2.095 bln
+166.356 mln
8.62%
jan 1, 1985
2.21 bln
+114.92 mln
5.48%
jan 1, 1986
2.26 bln
+49.26 mln
2.23%
jan 1, 1987
2.456 bln
+196.054 mln
8.68%
jan 1, 1988
2.724 bln
+268.46 mln
10.93%
jan 1, 1989
2.926 bln
+202.026 mln
7.42%
jan 1, 1990
3.039 bln
+112.913 mln
3.86%
jan 1, 1991
3.183 bln
+144.256 mln
4.75%
jan 1, 1992
3.32 bln
+136.205 mln
4.28%
jan 1, 1993
3.666 bln
+346.037 mln
10.42%
jan 1, 1994
3.864 bln
+198.048 mln
5.4%
jan 1, 1995
4.093 bln
+229.465 mln
5.94%
jan 1, 1996
4.188 bln
+94.481 mln
2.31%
jan 1, 1997
4.274 bln
+85.986 mln
2.05%
jan 1, 1998
4.293 bln
+19.345 mln
0.45%
jan 1, 1999
4.216 bln
-76.457 mln
-1.78%
jan 1, 2000
4.22 bln
+3.547 mln
0.08%
jan 1, 2001
4.497 bln
+277.405 mln
6.57%
jan 1, 2002
4.639 bln
+141.277 mln
3.14%
jan 1, 2003
4.857 bln
+218.382 mln
4.71%
jan 1, 2004
4.905 bln
+48.22 mln
0.99%
jan 1, 2005
5.285 bln
+379.959 mln
7.75%
jan 1, 2006
5.23 bln
-55.403 mln
-1.05%
jan 1, 2007
5.357 bln
+126.642 mln
2.42%
jan 1, 2008
5.652 bln
+295.723 mln
5.52%
jan 1, 2009
5.868 bln
+215.854 mln
3.82%
jan 1, 2010
6.027 bln
+159.095 mln
2.71%
jan 1, 2011
6.575 bln
+547.788 mln
9.09%
jan 1, 2012
7.289 bln
+713.755 mln
10.86%
jan 1, 2013
7.926 bln
+636.986 mln
8.74%
jan 1, 2014
9.106 bln
+1.18 bln
14.89%
jan 1, 2015
9.61 bln
+503.992 mln
5.53%
jan 1, 2016
10.15 bln
+540.02 mln
5.62%
Ranking of countries by current statistics by years


Comments: