29
/
en
AIzaSyAYiBZKx7MnpbEhh9jyipgxe19OcubqV5w
April 1, 2024
159511
Ireland
IRL
true
2
1
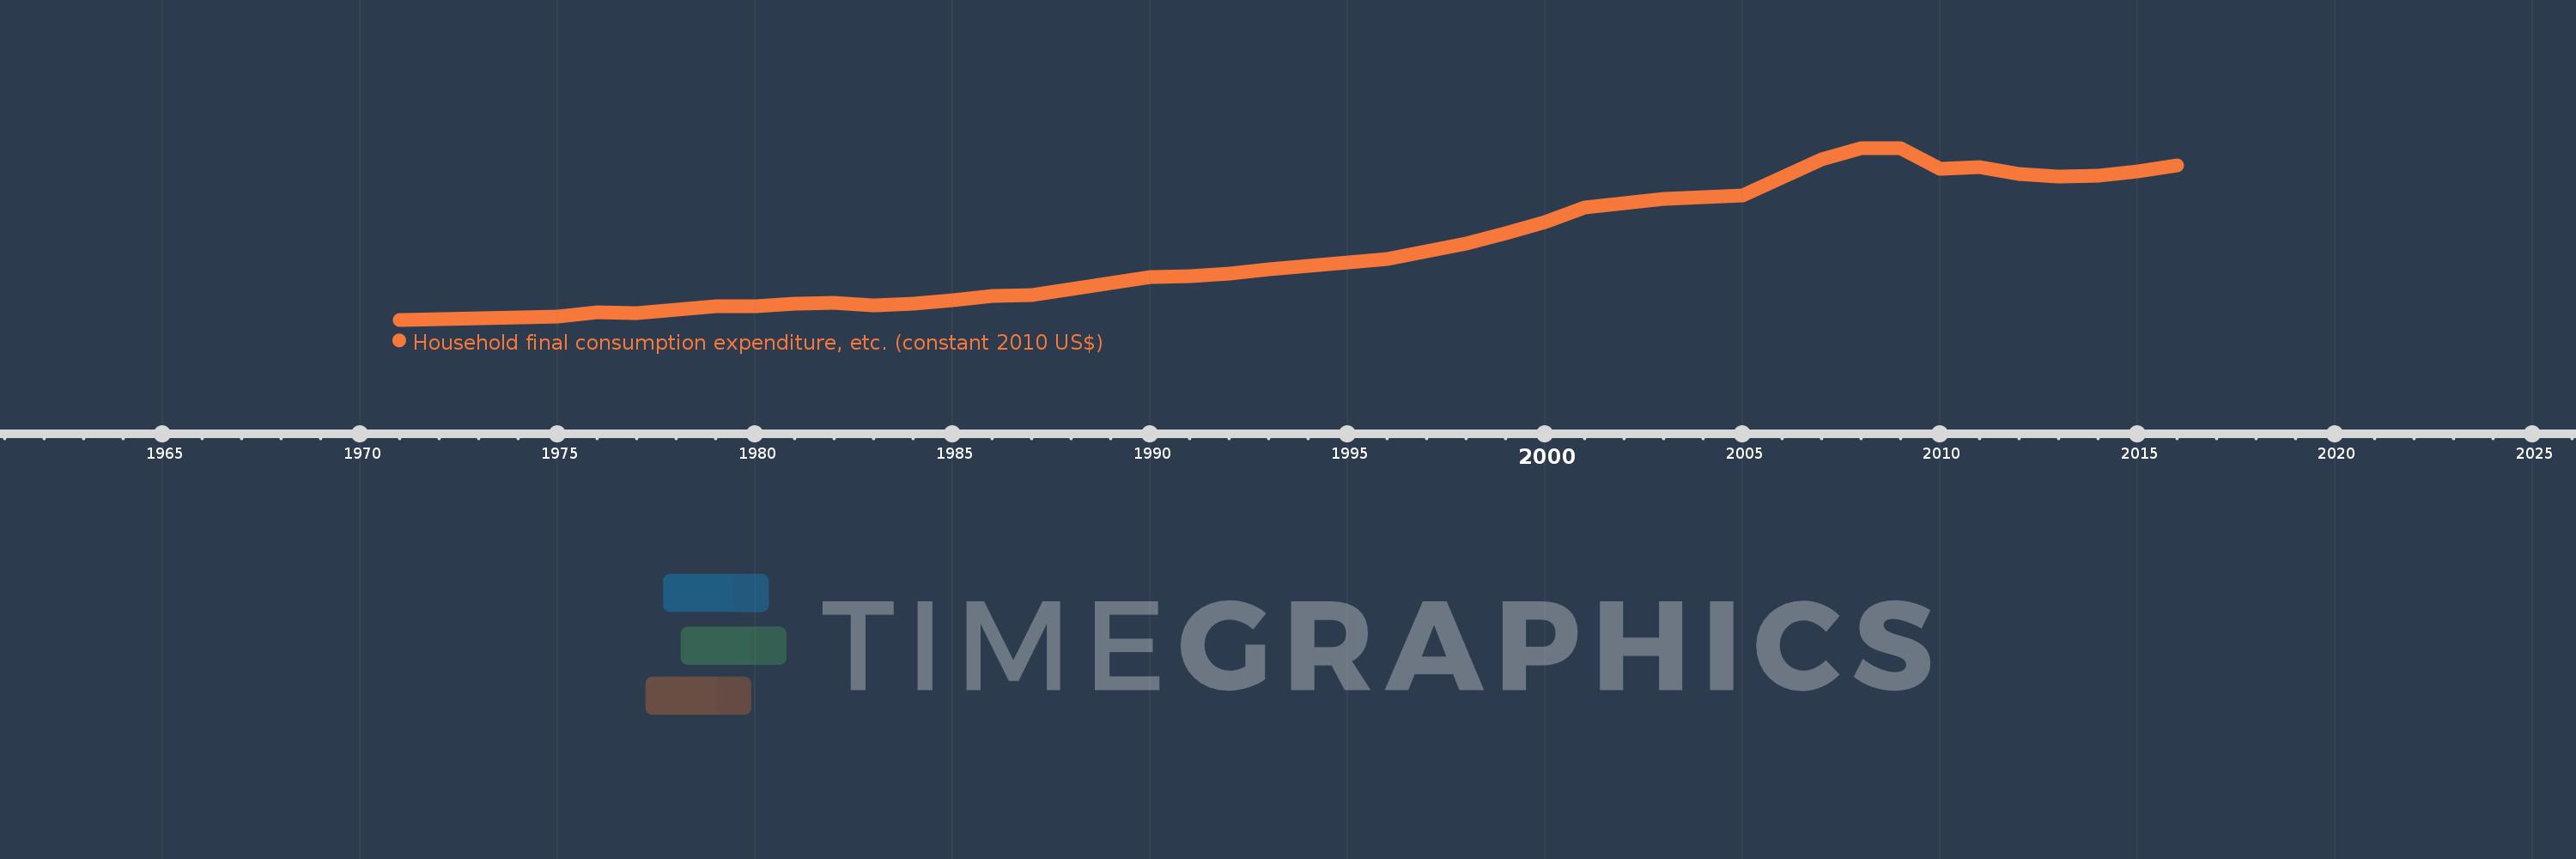
Household final consumption expenditure, etc. (constant 2010 US$)
2016,2015,2014,2013,2012,2011,2010,2009,2008,2007,2006,2005,2004,2003,2002,2001,2000,1999,1998,1997,1996,1995,1994,1993,1992,1991,1990,1989,1988,1987,1986,1985,1984,1983,1982,1981,1980,1979,1978,1977,1976,1975,1974,1973,1972,1971
This statistics in other country:
AfghanistanAlbaniaAlgeriaAngolaAntigua and BarbudaArab WorldArgentinaArmeniaArubaAustraliaAustriaAzerbaijanBahamas, TheBahrainBangladeshBarbadosBelarusBelgiumBelizeBeninBermudaBhutanBoliviaBosnia and HerzegovinaBotswanaBrazilBrunei DarussalamBulgariaBurkina FasoBurundiCabo VerdeCambodiaCameroonCanadaCaribbean small statesCentral African RepublicCentral Europe and the BalticsChadChileChinaColombiaComorosCongo, Dem. Rep.Congo, Rep.Cote d'IvoireCroatiaCubaCyprusCzech RepublicDenmarkDominicaDominican RepublicEarly-demographic dividendEast Asia & PacificEast Asia & Pacific (excluding high income)East Asia & Pacific (IDA & IBRD countries)EcuadorEgypt, Arab Rep.El SalvadorEquatorial GuineaEritreaEstoniaEuro areaEurope & Central AsiaEurope & Central Asia (excluding high income)Europe & Central Asia (IDA & IBRD countries)European UnionFaroe IslandsFinlandFragile and conflict affected situationsFranceGabonGambia, TheGeorgiaGermanyGhanaGreeceGrenadaGuatemalaGuineaGuinea-BissauGuyanaHaitiHeavily indebted poor countries (HIPC)High incomeHondurasHong Kong SAR, ChinaHungaryIBRD onlyIcelandIDA & IBRD totalIDA blendIDA onlyIDA totalIndiaIndonesiaIran, Islamic Rep.IraqIrelandIsraelItalyJamaicaJapanJordanKazakhstanKenyaKorea, Rep.KosovoKuwaitKyrgyz RepublicLao PDRLate-demographic dividendLatin America & Caribbean Latin America & Caribbean (excluding high income)Latin America & the Caribbean (IDA & IBRD countries)LatviaLeast developed countries: UN classificationLebanonLiberiaLithuaniaLow & middle incomeLow incomeLower middle incomeLuxembourgMacao SAR, ChinaMacedonia, FYRMadagascarMalawiMalaysiaMaliMaltaMauritaniaMauritiusMexicoMiddle East & North AfricaMiddle East & North Africa (excluding high income)Middle East & North Africa (IDA & IBRD countries)Middle incomeMoldovaMongoliaMontenegroMoroccoMozambiqueNamibiaNepalNetherlandsNew ZealandNicaraguaNigerNigeriaNorth AmericaNorwayOECD membersOmanOther small statesPakistanPanamaParaguayPeruPhilippinesPolandPortugalPost-demographic dividendPre-demographic dividendPuerto RicoQatarRomaniaRussian FederationRwandaSaudi ArabiaSenegalSerbiaSeychellesSierra LeoneSingaporeSlovak RepublicSloveniaSmall statesSouth AfricaSouth AsiaSouth Asia (IDA & IBRD)South SudanSpainSri LankaSt. Kitts and NevisSt. LuciaSt. Vincent and the GrenadinesSub-Saharan Africa Sub-Saharan Africa (excluding high income)Sub-Saharan Africa (IDA & IBRD countries)SudanSurinameSwazilandSwedenSwitzerlandTajikistanTanzaniaThailandTimor-LesteTogoTongaTrinidad and TobagoTunisiaTurkeyTurkmenistanUgandaUkraineUnited Arab EmiratesUnited KingdomUnited StatesUpper middle incomeUruguayUzbekistanVanuatuVenezuela, RBVietnamWest Bank and GazaWorldYemen, Rep.ZambiaZimbabwe Timeline:
This timeline shows a graph from 1971 to 2016 of Ireland. No data until 1970. Number of actual observations by date: 46.
Source name:
World Development Indicators
Source organization:
World Bank national accounts data, and OECD National Accounts data files.
Categories, topics:
Economy & Growth
Last updated:
apr 23, 2017
Indicators value changes by year
Minimum:
19.894 bln
jan 1, 1971
Maximum:
114.878 bln
jan 1, 2009
At the date of observation
Value
Absolute change
Change from previous value
jan 1, 1971
19.894 bln
+19.894 bln
0.0%
jan 1, 1972
20.218 bln
+324.043 mln
1.63%
jan 1, 1973
20.614 bln
+396.249 mln
1.96%
jan 1, 1974
21.32 bln
+705.531 mln
3.42%
jan 1, 1975
21.802 bln
+482.47 mln
2.26%
jan 1, 1976
23.84 bln
+2.037 bln
9.34%
jan 1, 1977
23.399 bln
-440.801 mln
-1.85%
jan 1, 1978
25.381 bln
+1.982 bln
8.47%
jan 1, 1979
27.45 bln
+2.069 bln
8.15%
jan 1, 1980
27.569 bln
+118.746 mln
0.43%
jan 1, 1981
28.905 bln
+1.337 bln
4.85%
jan 1, 1982
29.419 bln
+513.584 mln
1.78%
jan 1, 1983
27.813 bln
-1.605 bln
-5.46%
jan 1, 1984
28.899 bln
+1.086 bln
3.9%
jan 1, 1985
30.813 bln
+1.914 bln
6.62%
jan 1, 1986
33.15 bln
+2.337 bln
7.58%
jan 1, 1987
33.471 bln
+320.147 mln
0.97%
jan 1, 1988
36.991 bln
+3.52 bln
10.52%
jan 1, 1989
40.41 bln
+3.419 bln
9.24%
jan 1, 1990
43.363 bln
+2.953 bln
7.31%
jan 1, 1991
44.049 bln
+686.243 mln
1.58%
jan 1, 1992
45.301 bln
+1.252 bln
2.84%
jan 1, 1993
47.698 bln
+2.398 bln
5.29%
jan 1, 1994
49.588 bln
+1.89 bln
3.96%
jan 1, 1995
51.603 bln
+2.015 bln
4.06%
jan 1, 1996
53.274 bln
+1.671 bln
3.24%
jan 1, 1997
57.911 bln
+4.637 bln
8.7%
jan 1, 1998
62.12 bln
+4.21 bln
7.27%
jan 1, 1999
67.534 bln
+5.414 bln
8.72%
jan 1, 2000
73.665 bln
+6.13 bln
9.08%
jan 1, 2001
81.994 bln
+8.329 bln
11.31%
jan 1, 2002
84.355 bln
+2.361 bln
2.88%
jan 1, 2003
86.675 bln
+2.32 bln
2.75%
jan 1, 2004
87.631 bln
+955.759 mln
1.1%
jan 1, 2005
88.422 bln
+790.889 mln
0.9%
jan 1, 2006
98.778 bln
+10.356 bln
11.71%
jan 1, 2007
108.571 bln
+9.793 bln
9.91%
jan 1, 2008
114.615 bln
+6.044 bln
5.57%
jan 1, 2009
114.878 bln
+262.253 mln
0.23%
jan 1, 2010
103.373 bln
-11.504 bln
-10.01%
jan 1, 2011
104.3 bln
+926.485 mln
0.9%
jan 1, 2012
100.291 bln
-4.009 bln
-3.84%
jan 1, 2013
98.944 bln
-1.346 bln
-1.34%
jan 1, 2014
99.481 bln
+537.192 mln
0.54%
jan 1, 2015
101.89 bln
+2.409 bln
2.42%
jan 1, 2016
105.029 bln
+3.139 bln
3.08%
Ranking of countries by current statistics by years


Comments: