29
/
en
AIzaSyAYiBZKx7MnpbEhh9jyipgxe19OcubqV5w
April 1, 2024
89907
Botswana
BWA
true
2
1
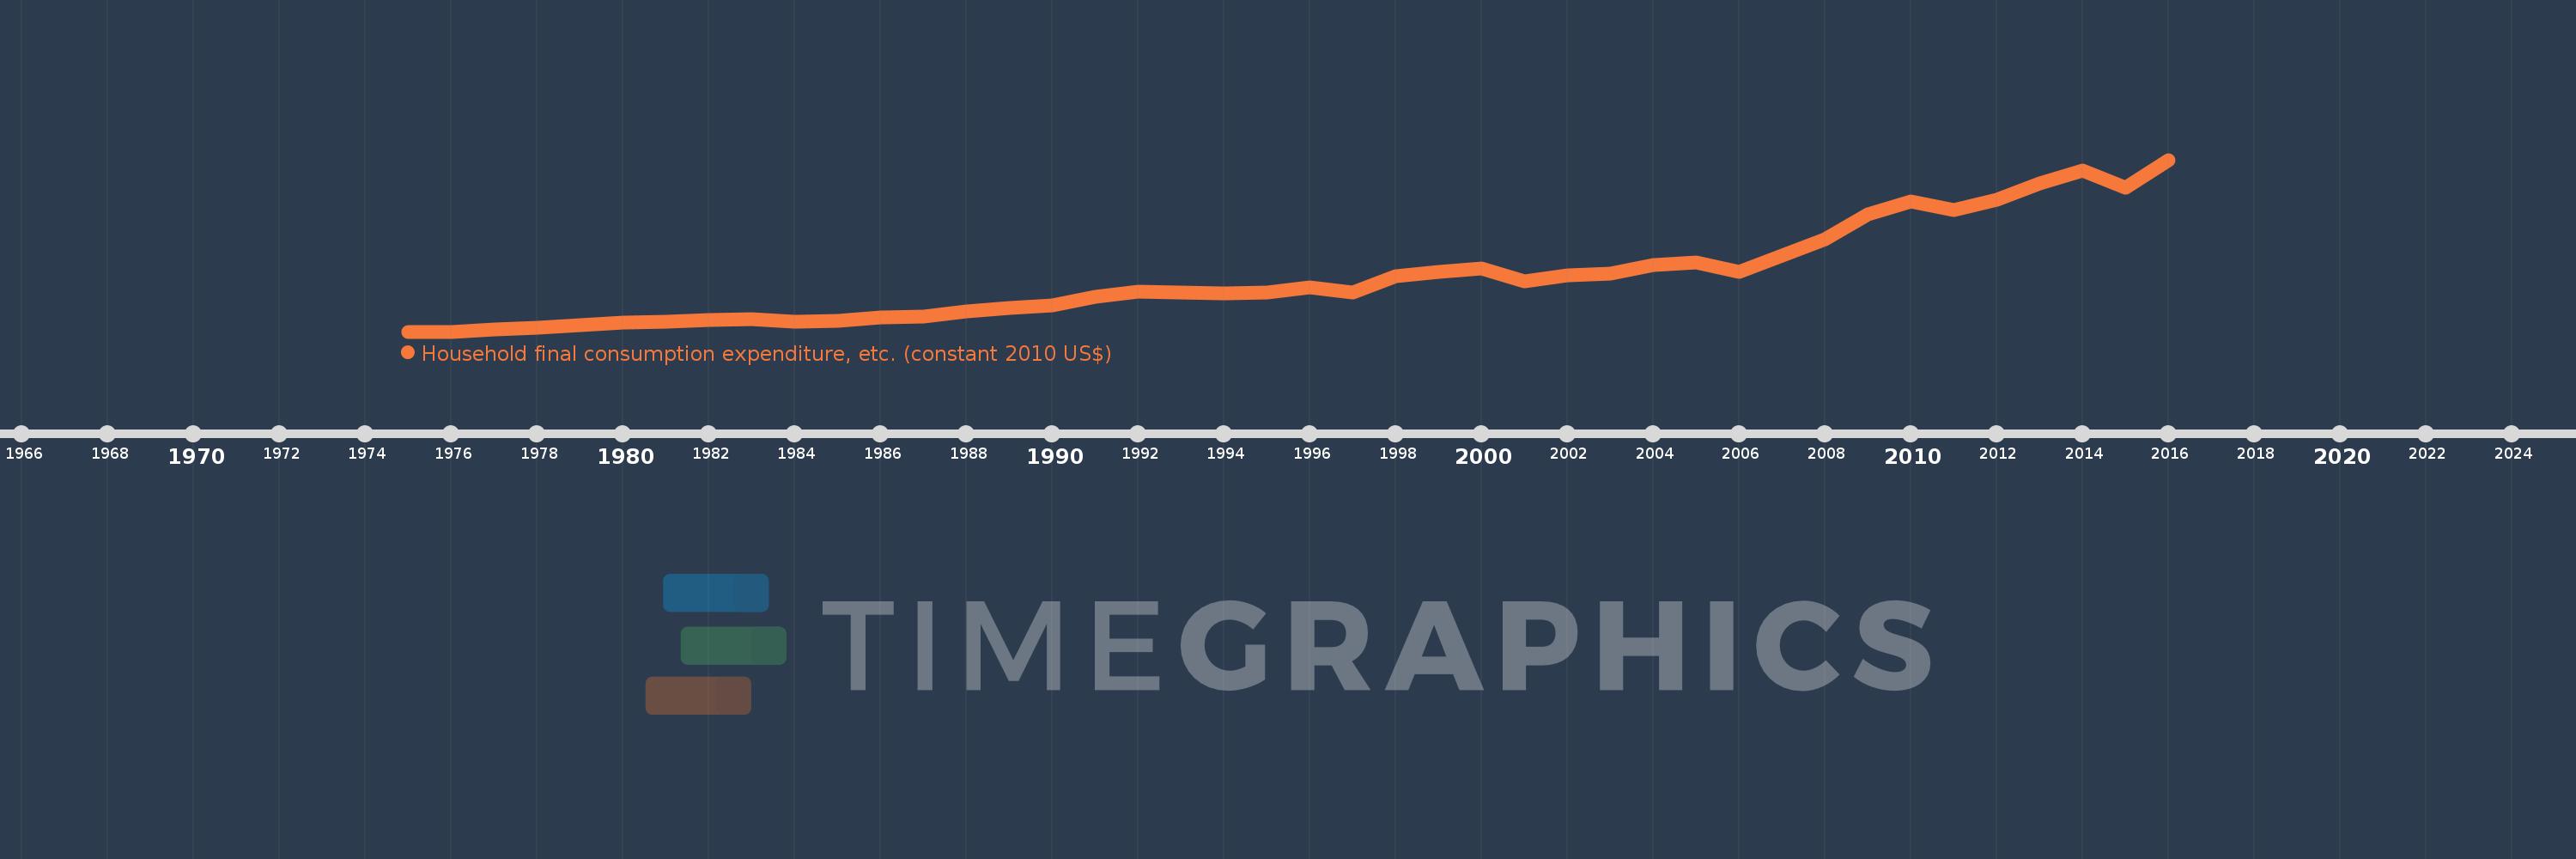
Household final consumption expenditure, etc. (constant 2010 US$)
2016,2015,2014,2013,2012,2011,2010,2009,2008,2007,2006,2005,2004,2003,2002,2001,2000,1999,1998,1997,1996,1995,1994,1993,1992,1991,1990,1989,1988,1987,1986,1985,1984,1983,1982,1981,1980,1979,1978,1977,1976,1975
This statistics in other country:
AfghanistanAlbaniaAlgeriaAngolaAntigua and BarbudaArab WorldArgentinaArmeniaArubaAustraliaAustriaAzerbaijanBahamas, TheBahrainBangladeshBarbadosBelarusBelgiumBelizeBeninBermudaBhutanBoliviaBosnia and HerzegovinaBotswanaBrazilBrunei DarussalamBulgariaBurkina FasoBurundiCabo VerdeCambodiaCameroonCanadaCaribbean small statesCentral African RepublicCentral Europe and the BalticsChadChileChinaColombiaComorosCongo, Dem. Rep.Congo, Rep.Cote d'IvoireCroatiaCubaCyprusCzech RepublicDenmarkDominicaDominican RepublicEarly-demographic dividendEast Asia & PacificEast Asia & Pacific (excluding high income)East Asia & Pacific (IDA & IBRD countries)EcuadorEgypt, Arab Rep.El SalvadorEquatorial GuineaEritreaEstoniaEuro areaEurope & Central AsiaEurope & Central Asia (excluding high income)Europe & Central Asia (IDA & IBRD countries)European UnionFaroe IslandsFinlandFragile and conflict affected situationsFranceGabonGambia, TheGeorgiaGermanyGhanaGreeceGrenadaGuatemalaGuineaGuinea-BissauGuyanaHaitiHeavily indebted poor countries (HIPC)High incomeHondurasHong Kong SAR, ChinaHungaryIBRD onlyIcelandIDA & IBRD totalIDA blendIDA onlyIDA totalIndiaIndonesiaIran, Islamic Rep.IraqIrelandIsraelItalyJamaicaJapanJordanKazakhstanKenyaKorea, Rep.KosovoKuwaitKyrgyz RepublicLao PDRLate-demographic dividendLatin America & Caribbean Latin America & Caribbean (excluding high income)Latin America & the Caribbean (IDA & IBRD countries)LatviaLeast developed countries: UN classificationLebanonLiberiaLithuaniaLow & middle incomeLow incomeLower middle incomeLuxembourgMacao SAR, ChinaMacedonia, FYRMadagascarMalawiMalaysiaMaliMaltaMauritaniaMauritiusMexicoMiddle East & North AfricaMiddle East & North Africa (excluding high income)Middle East & North Africa (IDA & IBRD countries)Middle incomeMoldovaMongoliaMontenegroMoroccoMozambiqueNamibiaNepalNetherlandsNew ZealandNicaraguaNigerNigeriaNorth AmericaNorwayOECD membersOmanOther small statesPakistanPanamaParaguayPeruPhilippinesPolandPortugalPost-demographic dividendPre-demographic dividendPuerto RicoQatarRomaniaRussian FederationRwandaSaudi ArabiaSenegalSerbiaSeychellesSierra LeoneSingaporeSlovak RepublicSloveniaSmall statesSouth AfricaSouth AsiaSouth Asia (IDA & IBRD)South SudanSpainSri LankaSt. Kitts and NevisSt. LuciaSt. Vincent and the GrenadinesSub-Saharan Africa Sub-Saharan Africa (excluding high income)Sub-Saharan Africa (IDA & IBRD countries)SudanSurinameSwazilandSwedenSwitzerlandTajikistanTanzaniaThailandTimor-LesteTogoTongaTrinidad and TobagoTunisiaTurkeyTurkmenistanUgandaUkraineUnited Arab EmiratesUnited KingdomUnited StatesUpper middle incomeUruguayUzbekistanVanuatuVenezuela, RBVietnamWest Bank and GazaWorldYemen, Rep.ZambiaZimbabwe Timeline:
This timeline shows a graph from 1975 to 2016 of Botswana. No data until 1974. Number of actual observations by date: 42.
Source name:
World Development Indicators
Source organization:
World Bank national accounts data, and OECD National Accounts data files.
Categories, topics:
Economy & Growth
Last updated:
apr 23, 2017
Indicators value changes by year
Minimum:
706.756 mln
jan 1, 1975
Maximum:
8.092 bln
jan 1, 2016
At the date of observation
Value
Absolute change
Change from previous value
jan 1, 1975
706.756 mln
+706.756 mln
0.0%
jan 1, 1976
706.756 mln
0.0
0.0%
jan 1, 1977
798.759 mln
+92.004 mln
13.02%
jan 1, 1978
874.068 mln
+75.309 mln
9.43%
jan 1, 1979
982.169 mln
+108.101 mln
12.37%
jan 1, 1980
1.105 bln
+122.439 mln
12.47%
jan 1, 1981
1.15 bln
+44.94 mln
4.07%
jan 1, 1982
1.221 bln
+71.293 mln
6.2%
jan 1, 1983
1.244 bln
+23.532 mln
1.93%
jan 1, 1984
1.139 bln
-105.18 mln
-8.45%
jan 1, 1985
1.165 bln
+25.955 mln
2.28%
jan 1, 1986
1.314 bln
+149.323 mln
12.82%
jan 1, 1987
1.351 bln
+36.111 mln
2.75%
jan 1, 1988
1.57 bln
+219.621 mln
16.26%
jan 1, 1989
1.708 bln
+137.474 mln
8.76%
jan 1, 1990
1.816 bln
+108.134 mln
6.33%
jan 1, 1991
2.22 bln
+404.006 mln
22.25%
jan 1, 1992
2.425 bln
+205.397 mln
9.25%
jan 1, 1993
2.397 bln
-28.039 mln
-1.16%
jan 1, 1994
2.348 bln
-49.313 mln
-2.06%
jan 1, 1995
2.393 bln
+45.011 mln
1.92%
jan 1, 1996
2.602 bln
+209.223 mln
8.74%
jan 1, 1997
2.404 bln
-197.811 mln
-7.6%
jan 1, 1998
3.097 bln
+692.328 mln
28.8%
jan 1, 1999
3.281 bln
+184.671 mln
5.96%
jan 1, 2000
3.438 bln
+157.047 mln
4.79%
jan 1, 2001
2.88 bln
-558.4 mln
-16.24%
jan 1, 2002
3.115 bln
+235.536 mln
8.18%
jan 1, 2003
3.21 bln
+94.926 mln
3.05%
jan 1, 2004
3.554 bln
+343.997 mln
10.72%
jan 1, 2005
3.687 bln
+132.443 mln
3.73%
jan 1, 2006
3.257 bln
-429.729 mln
-11.66%
jan 1, 2007
3.968 bln
+710.966 mln
21.83%
jan 1, 2008
4.667 bln
+699.09 mln
17.62%
jan 1, 2009
5.762 bln
+1.095 bln
23.45%
jan 1, 2010
6.31 bln
+547.816 mln
9.51%
jan 1, 2011
5.941 bln
-368.841 mln
-5.85%
jan 1, 2012
6.361 bln
+420.001 mln
7.07%
jan 1, 2013
7.068 bln
+707.474 mln
11.12%
jan 1, 2014
7.645 bln
+576.559 mln
8.16%
jan 1, 2015
6.884 bln
-760.323 mln
-9.95%
jan 1, 2016
8.092 bln
+1.208 bln
17.54%
Ranking of countries by current statistics by years


Comments: