29
/
en
AIzaSyAYiBZKx7MnpbEhh9jyipgxe19OcubqV5w
April 1, 2024
58995
Sub-Saharan Africa
SSF
false
2
1
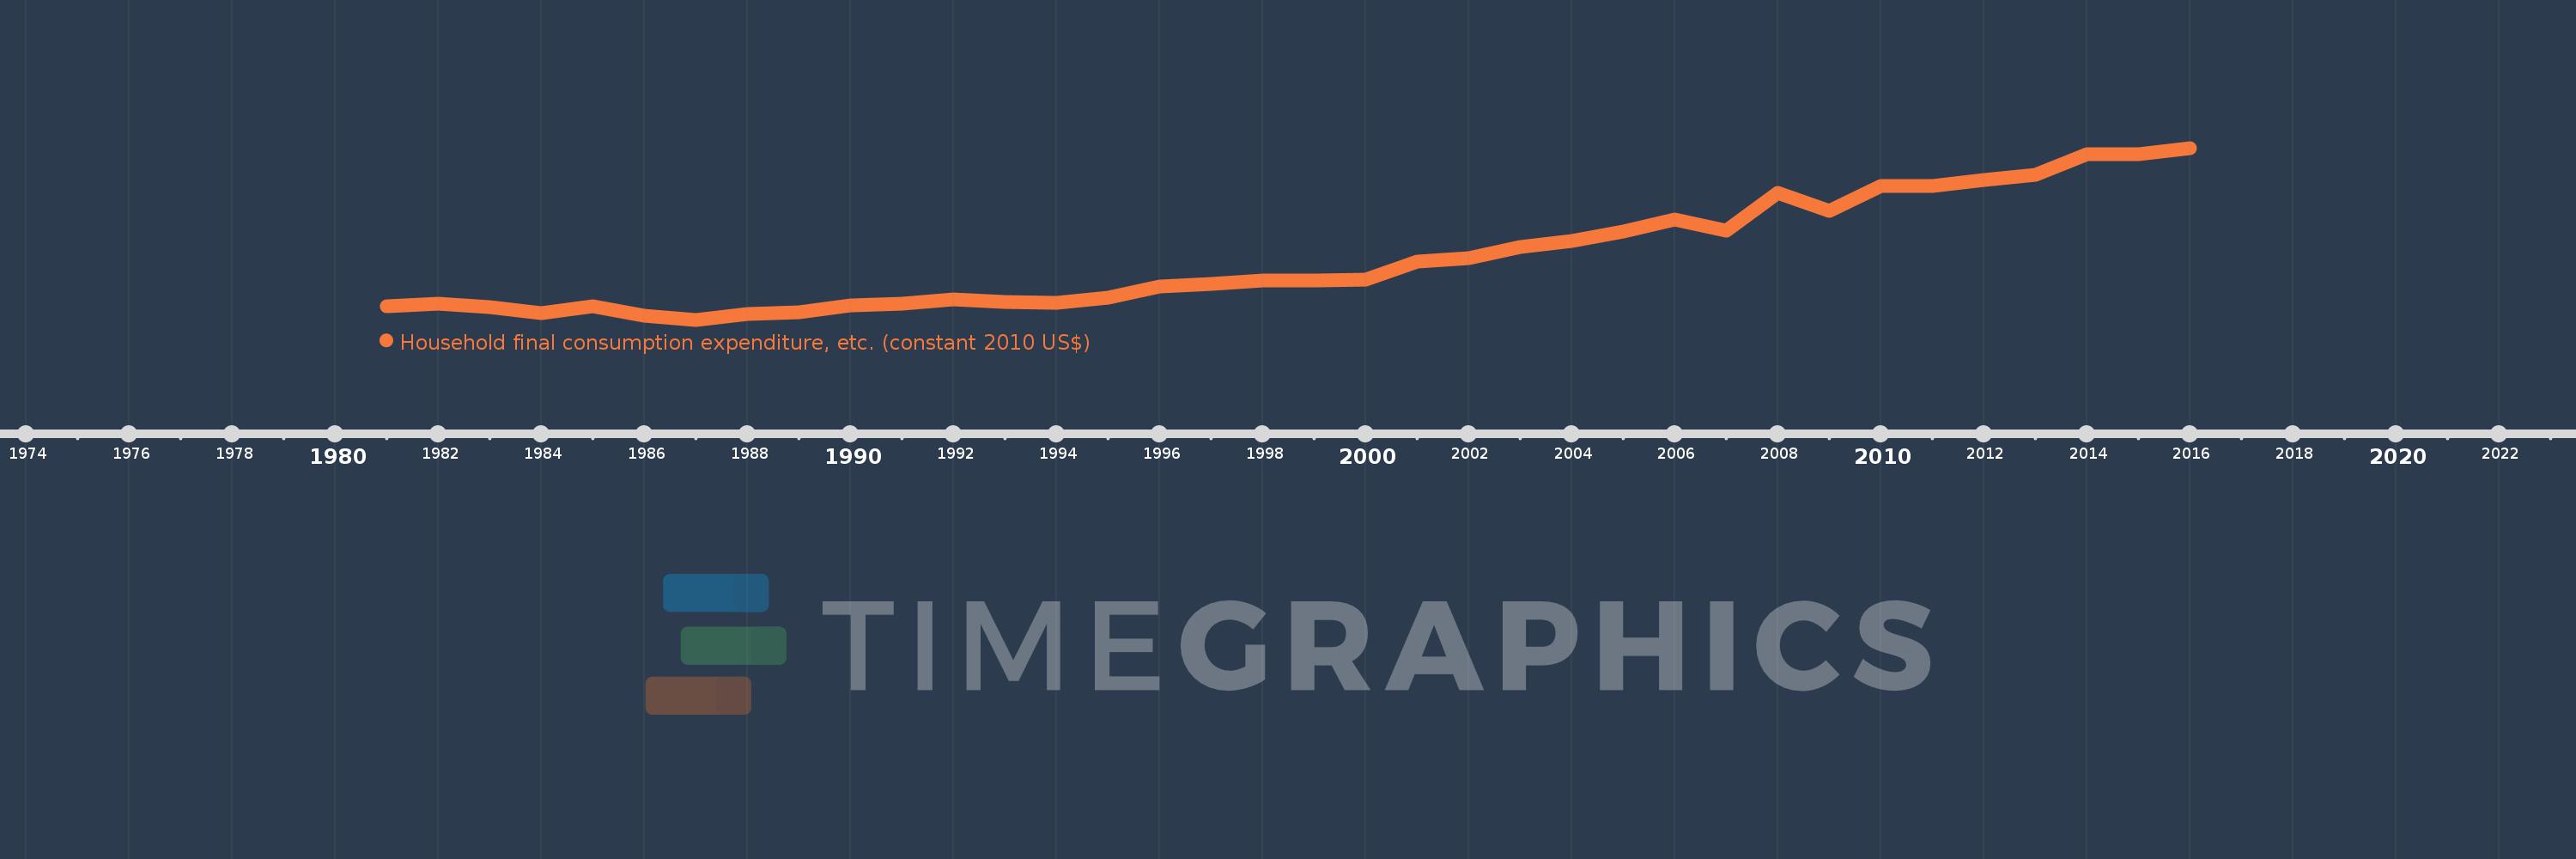
Household final consumption expenditure, etc. (constant 2010 US$)
2016,2015,2014,2013,2012,2011,2010,2009,2008,2007,2006,2005,2004,2003,2002,2001,2000,1999,1998,1997,1996,1995,1994,1993,1992,1991,1990,1989,1988,1987,1986,1985,1984,1983,1982,1981
This statistics in other country:
AfghanistanAlbaniaAlgeriaAngolaAntigua and BarbudaArab WorldArgentinaArmeniaArubaAustraliaAustriaAzerbaijanBahamas, TheBahrainBangladeshBarbadosBelarusBelgiumBelizeBeninBermudaBhutanBoliviaBosnia and HerzegovinaBotswanaBrazilBrunei DarussalamBulgariaBurkina FasoBurundiCabo VerdeCambodiaCameroonCanadaCaribbean small statesCentral African RepublicCentral Europe and the BalticsChadChileChinaColombiaComorosCongo, Dem. Rep.Congo, Rep.Cote d'IvoireCroatiaCubaCyprusCzech RepublicDenmarkDominicaDominican RepublicEarly-demographic dividendEast Asia & PacificEast Asia & Pacific (excluding high income)East Asia & Pacific (IDA & IBRD countries)EcuadorEgypt, Arab Rep.El SalvadorEquatorial GuineaEritreaEstoniaEuro areaEurope & Central AsiaEurope & Central Asia (excluding high income)Europe & Central Asia (IDA & IBRD countries)European UnionFaroe IslandsFinlandFragile and conflict affected situationsFranceGabonGambia, TheGeorgiaGermanyGhanaGreeceGrenadaGuatemalaGuineaGuinea-BissauGuyanaHaitiHeavily indebted poor countries (HIPC)High incomeHondurasHong Kong SAR, ChinaHungaryIBRD onlyIcelandIDA & IBRD totalIDA blendIDA onlyIDA totalIndiaIndonesiaIran, Islamic Rep.IraqIrelandIsraelItalyJamaicaJapanJordanKazakhstanKenyaKorea, Rep.KosovoKuwaitKyrgyz RepublicLao PDRLate-demographic dividendLatin America & Caribbean Latin America & Caribbean (excluding high income)Latin America & the Caribbean (IDA & IBRD countries)LatviaLeast developed countries: UN classificationLebanonLiberiaLithuaniaLow & middle incomeLow incomeLower middle incomeLuxembourgMacao SAR, ChinaMacedonia, FYRMadagascarMalawiMalaysiaMaliMaltaMauritaniaMauritiusMexicoMiddle East & North AfricaMiddle East & North Africa (excluding high income)Middle East & North Africa (IDA & IBRD countries)Middle incomeMoldovaMongoliaMontenegroMoroccoMozambiqueNamibiaNepalNetherlandsNew ZealandNicaraguaNigerNigeriaNorth AmericaNorwayOECD membersOmanOther small statesPakistanPanamaParaguayPeruPhilippinesPolandPortugalPost-demographic dividendPre-demographic dividendPuerto RicoQatarRomaniaRussian FederationRwandaSaudi ArabiaSenegalSerbiaSeychellesSierra LeoneSingaporeSlovak RepublicSloveniaSmall statesSouth AfricaSouth AsiaSouth Asia (IDA & IBRD)South SudanSpainSri LankaSt. Kitts and NevisSt. LuciaSt. Vincent and the GrenadinesSub-Saharan Africa Sub-Saharan Africa (excluding high income)Sub-Saharan Africa (IDA & IBRD countries)SudanSurinameSwazilandSwedenSwitzerlandTajikistanTanzaniaThailandTimor-LesteTogoTongaTrinidad and TobagoTunisiaTurkeyTurkmenistanUgandaUkraineUnited Arab EmiratesUnited KingdomUnited StatesUpper middle incomeUruguayUzbekistanVanuatuVenezuela, RBVietnamWest Bank and GazaWorldYemen, Rep.ZambiaZimbabwe Timeline:
This timeline shows a graph from 1981 to 2016 of Sub-Saharan Africa . No data until 1980. Number of actual observations by date: 36.
Source name:
World Development Indicators
Source organization:
World Bank national accounts data, and OECD National Accounts data files.
Categories, topics:
Economy & Growth
Last updated:
apr 23, 2017
Indicators value changes by year
Minimum:
356.688 bln
jan 1, 1987
Maximum:
1.014 trl
jan 1, 2016
At the date of observation
Value
Absolute change
Change from previous value
jan 1, 1981
408.305 bln
+408.305 bln
0.0%
jan 1, 1982
419.284 bln
+10.979 bln
2.69%
jan 1, 1983
404.398 bln
-14.887 bln
-3.55%
jan 1, 1984
380.744 bln
-23.653 bln
-5.85%
jan 1, 1985
408.655 bln
+27.911 bln
7.33%
jan 1, 1986
371.702 bln
-36.953 bln
-9.04%
jan 1, 1987
356.688 bln
-15.015 bln
-4.04%
jan 1, 1988
377.745 bln
+21.057 bln
5.9%
jan 1, 1989
385.24 bln
+7.495 bln
1.98%
jan 1, 1990
412.027 bln
+26.787 bln
6.95%
jan 1, 1991
419.224 bln
+7.197 bln
1.75%
jan 1, 1992
433.699 bln
+14.475 bln
3.45%
jan 1, 1993
424.743 bln
-8.956 bln
-2.07%
jan 1, 1994
420.621 bln
-4.121 bln
-0.97%
jan 1, 1995
439.935 bln
+19.314 bln
4.59%
jan 1, 1996
484.418 bln
+44.483 bln
10.11%
jan 1, 1997
492.301 bln
+7.882 bln
1.63%
jan 1, 1998
507.976 bln
+15.676 bln
3.18%
jan 1, 1999
506.346 bln
-1.63 bln
-0.32%
jan 1, 2000
510.309 bln
+3.963 bln
0.78%
jan 1, 2001
579.697 bln
+69.387 bln
13.6%
jan 1, 2002
590.952 bln
+11.255 bln
1.94%
jan 1, 2003
633.891 bln
+42.94 bln
7.27%
jan 1, 2004
658.55 bln
+24.659 bln
3.89%
jan 1, 2005
693.26 bln
+34.71 bln
5.27%
jan 1, 2006
741.131 bln
+47.871 bln
6.91%
jan 1, 2007
697.617 bln
-43.514 bln
-5.87%
jan 1, 2008
841.248 bln
+143.631 bln
20.59%
jan 1, 2009
774.87 bln
-66.377 bln
-7.89%
jan 1, 2010
867.99 bln
+93.119 bln
12.02%
jan 1, 2011
869.486 bln
+1.496 bln
0.17%
jan 1, 2012
890.335 bln
+20.849 bln
2.4%
jan 1, 2013
912.774 bln
+22.439 bln
2.52%
jan 1, 2014
989.262 bln
+76.488 bln
8.38%
jan 1, 2015
989.868 bln
+606.138 mln
0.06%
jan 1, 2016
1.014 trl
+24.494 bln
2.47%
Ranking of countries by current statistics by years


Comments: