29
/
en
AIzaSyAYiBZKx7MnpbEhh9jyipgxe19OcubqV5w
April 1, 2024
205370
Namibia
NAM
true
2
1
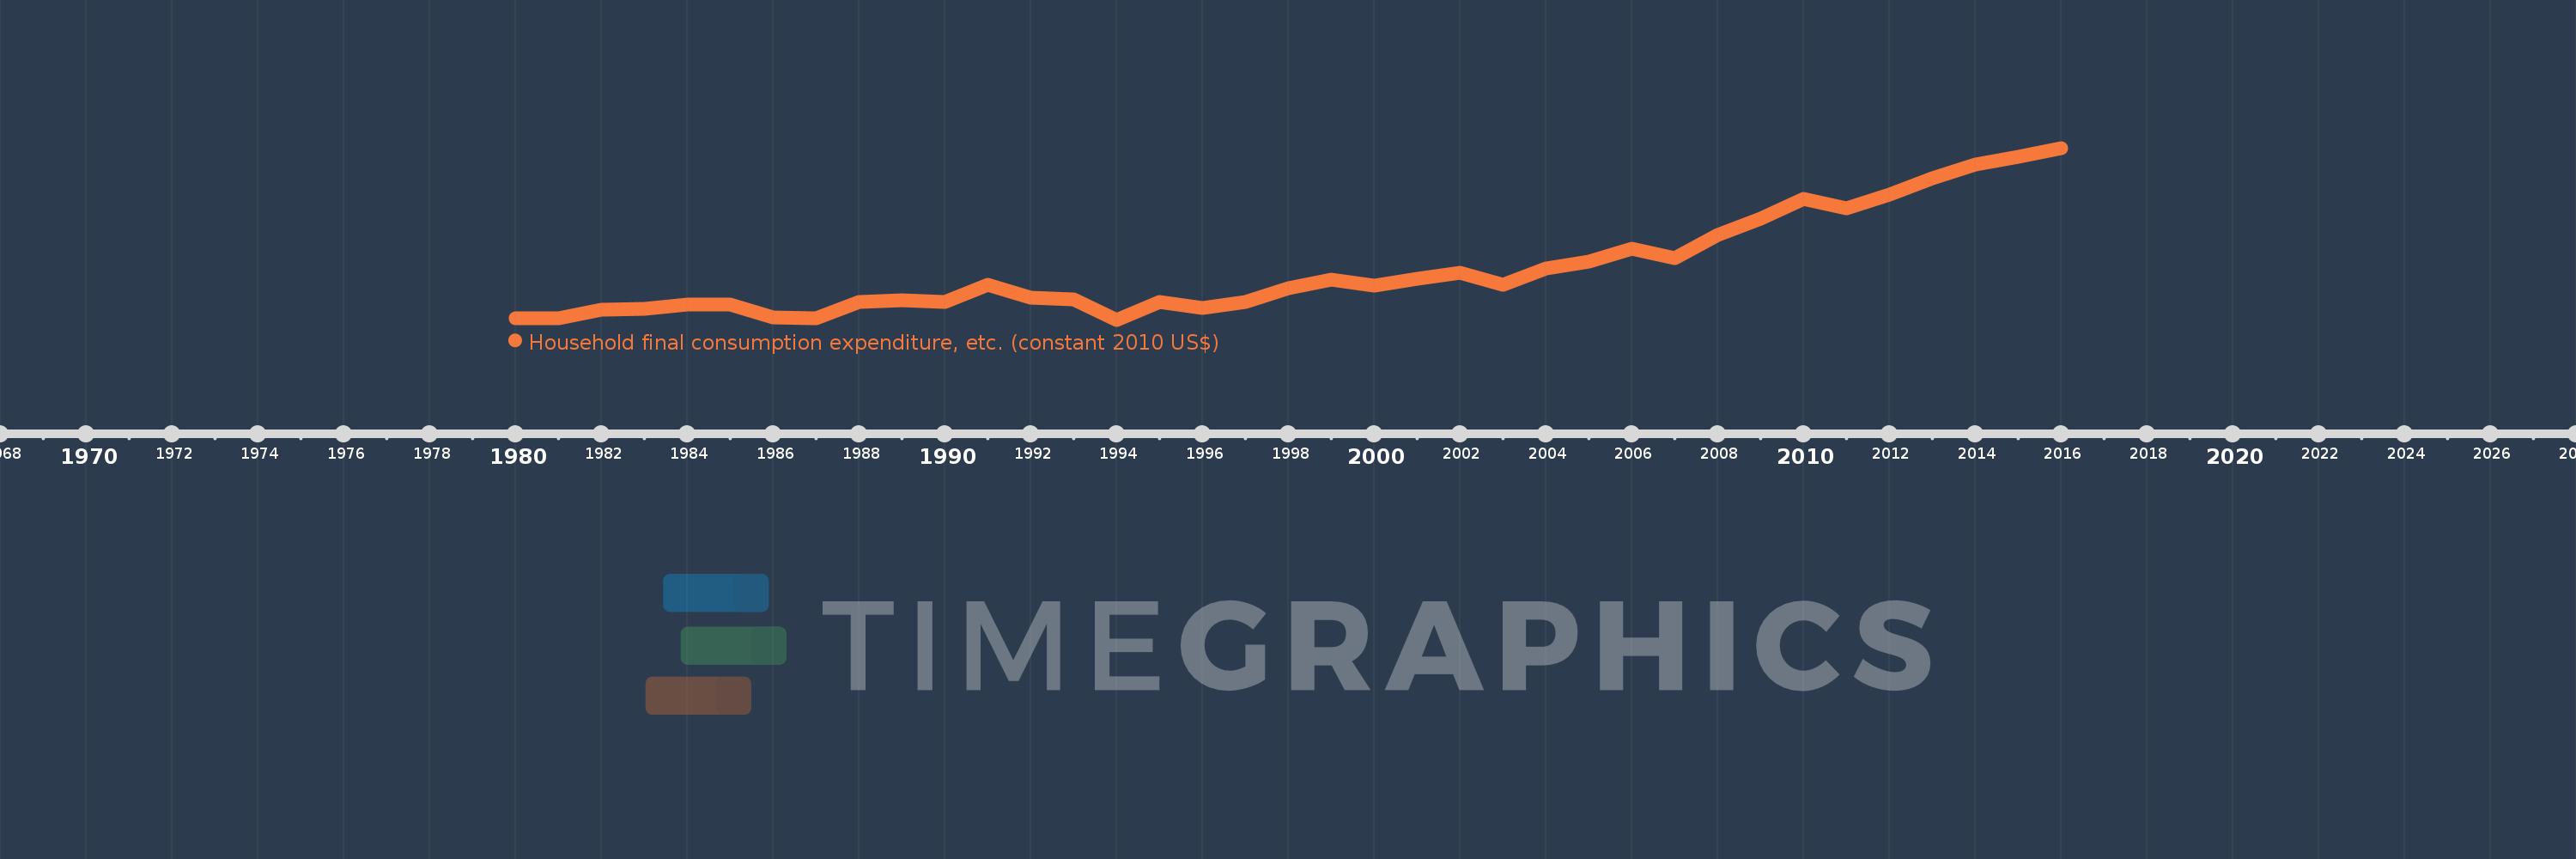
Household final consumption expenditure, etc. (constant 2010 US$)
2016,2015,2014,2013,2012,2011,2010,2009,2008,2007,2006,2005,2004,2003,2002,2001,2000,1999,1998,1997,1996,1995,1994,1993,1992,1991,1990,1989,1988,1987,1986,1985,1984,1983,1982,1981,1980
This statistics in other country:
AfghanistanAlbaniaAlgeriaAngolaAntigua and BarbudaArab WorldArgentinaArmeniaArubaAustraliaAustriaAzerbaijanBahamas, TheBahrainBangladeshBarbadosBelarusBelgiumBelizeBeninBermudaBhutanBoliviaBosnia and HerzegovinaBotswanaBrazilBrunei DarussalamBulgariaBurkina FasoBurundiCabo VerdeCambodiaCameroonCanadaCaribbean small statesCentral African RepublicCentral Europe and the BalticsChadChileChinaColombiaComorosCongo, Dem. Rep.Congo, Rep.Cote d'IvoireCroatiaCubaCyprusCzech RepublicDenmarkDominicaDominican RepublicEarly-demographic dividendEast Asia & PacificEast Asia & Pacific (excluding high income)East Asia & Pacific (IDA & IBRD countries)EcuadorEgypt, Arab Rep.El SalvadorEquatorial GuineaEritreaEstoniaEuro areaEurope & Central AsiaEurope & Central Asia (excluding high income)Europe & Central Asia (IDA & IBRD countries)European UnionFaroe IslandsFinlandFragile and conflict affected situationsFranceGabonGambia, TheGeorgiaGermanyGhanaGreeceGrenadaGuatemalaGuineaGuinea-BissauGuyanaHaitiHeavily indebted poor countries (HIPC)High incomeHondurasHong Kong SAR, ChinaHungaryIBRD onlyIcelandIDA & IBRD totalIDA blendIDA onlyIDA totalIndiaIndonesiaIran, Islamic Rep.IraqIrelandIsraelItalyJamaicaJapanJordanKazakhstanKenyaKorea, Rep.KosovoKuwaitKyrgyz RepublicLao PDRLate-demographic dividendLatin America & Caribbean Latin America & Caribbean (excluding high income)Latin America & the Caribbean (IDA & IBRD countries)LatviaLeast developed countries: UN classificationLebanonLiberiaLithuaniaLow & middle incomeLow incomeLower middle incomeLuxembourgMacao SAR, ChinaMacedonia, FYRMadagascarMalawiMalaysiaMaliMaltaMauritaniaMauritiusMexicoMiddle East & North AfricaMiddle East & North Africa (excluding high income)Middle East & North Africa (IDA & IBRD countries)Middle incomeMoldovaMongoliaMontenegroMoroccoMozambiqueNamibiaNepalNetherlandsNew ZealandNicaraguaNigerNigeriaNorth AmericaNorwayOECD membersOmanOther small statesPakistanPanamaParaguayPeruPhilippinesPolandPortugalPost-demographic dividendPre-demographic dividendPuerto RicoQatarRomaniaRussian FederationRwandaSaudi ArabiaSenegalSerbiaSeychellesSierra LeoneSingaporeSlovak RepublicSloveniaSmall statesSouth AfricaSouth AsiaSouth Asia (IDA & IBRD)South SudanSpainSri LankaSt. Kitts and NevisSt. LuciaSt. Vincent and the GrenadinesSub-Saharan Africa Sub-Saharan Africa (excluding high income)Sub-Saharan Africa (IDA & IBRD countries)SudanSurinameSwazilandSwedenSwitzerlandTajikistanTanzaniaThailandTimor-LesteTogoTongaTrinidad and TobagoTunisiaTurkeyTurkmenistanUgandaUkraineUnited Arab EmiratesUnited KingdomUnited StatesUpper middle incomeUruguayUzbekistanVanuatuVenezuela, RBVietnamWest Bank and GazaWorldYemen, Rep.ZambiaZimbabwe Timeline:
This timeline shows a graph from 1980 to 2016 of Namibia. No data until 1979. Number of actual observations by date: 37.
Source name:
World Development Indicators
Source organization:
World Bank national accounts data, and OECD National Accounts data files.
Categories, topics:
Economy & Growth
Last updated:
apr 23, 2017
Indicators value changes by year
Minimum:
1.964 bln
jan 1, 1994
Maximum:
9.908 bln
jan 1, 2016
At the date of observation
Value
Absolute change
Change from previous value
jan 1, 1980
2.032 bln
+2.032 bln
0.0%
jan 1, 1981
2.032 bln
+13.659
0.0%
jan 1, 1982
2.425 bln
+392.683 mln
19.32%
jan 1, 1983
2.454 bln
+29.301 mln
1.21%
jan 1, 1984
2.657 bln
+202.681 mln
8.26%
jan 1, 1985
2.666 bln
+9.627 mln
0.36%
jan 1, 1986
2.061 bln
-604.923 mln
-22.69%
jan 1, 1987
2.046 bln
-15.553 mln
-0.75%
jan 1, 1988
2.8 bln
+753.916 mln
36.85%
jan 1, 1989
2.863 bln
+63.389 mln
2.26%
jan 1, 1990
2.785 bln
-77.772 mln
-2.72%
jan 1, 1991
3.586 bln
+800.114 mln
28.72%
jan 1, 1992
3.0 bln
-586.048 mln
-16.34%
jan 1, 1993
2.899 bln
-100.84 mln
-3.36%
jan 1, 1994
1.964 bln
-935.157 mln
-32.26%
jan 1, 1995
2.792 bln
+828.82 mln
42.21%
jan 1, 1996
2.521 bln
-270.844 mln
-9.7%
jan 1, 1997
2.782 bln
+260.446 mln
10.33%
jan 1, 1998
3.417 bln
+635.115 mln
22.83%
jan 1, 1999
3.817 bln
+400.156 mln
11.71%
jan 1, 2000
3.541 bln
-276.633 mln
-7.25%
jan 1, 2001
3.864 bln
+323.59 mln
9.14%
jan 1, 2002
4.154 bln
+289.947 mln
7.5%
jan 1, 2003
3.582 bln
-572.355 mln
-13.78%
jan 1, 2004
4.331 bln
+749.399 mln
20.92%
jan 1, 2005
4.671 bln
+339.512 mln
7.84%
jan 1, 2006
5.25 bln
+579.836 mln
12.41%
jan 1, 2007
4.809 bln
-441.03 mln
-8.4%
jan 1, 2008
5.877 bln
+1.067 bln
22.19%
jan 1, 2009
6.628 bln
+751.468 mln
12.79%
jan 1, 2010
7.55 bln
+921.763 mln
13.91%
jan 1, 2011
7.133 bln
-417.382 mln
-5.53%
jan 1, 2012
7.766 bln
+633.045 mln
8.88%
jan 1, 2013
8.511 bln
+745.226 mln
9.6%
jan 1, 2014
9.142 bln
+631.525 mln
7.42%
jan 1, 2015
9.515 bln
+372.072 mln
4.07%
jan 1, 2016
9.908 bln
+393.869 mln
4.14%
Ranking of countries by current statistics by years


Comments: