29
/
en
AIzaSyAYiBZKx7MnpbEhh9jyipgxe19OcubqV5w
April 1, 2024
126282
El Salvador
SLV
true
2
1
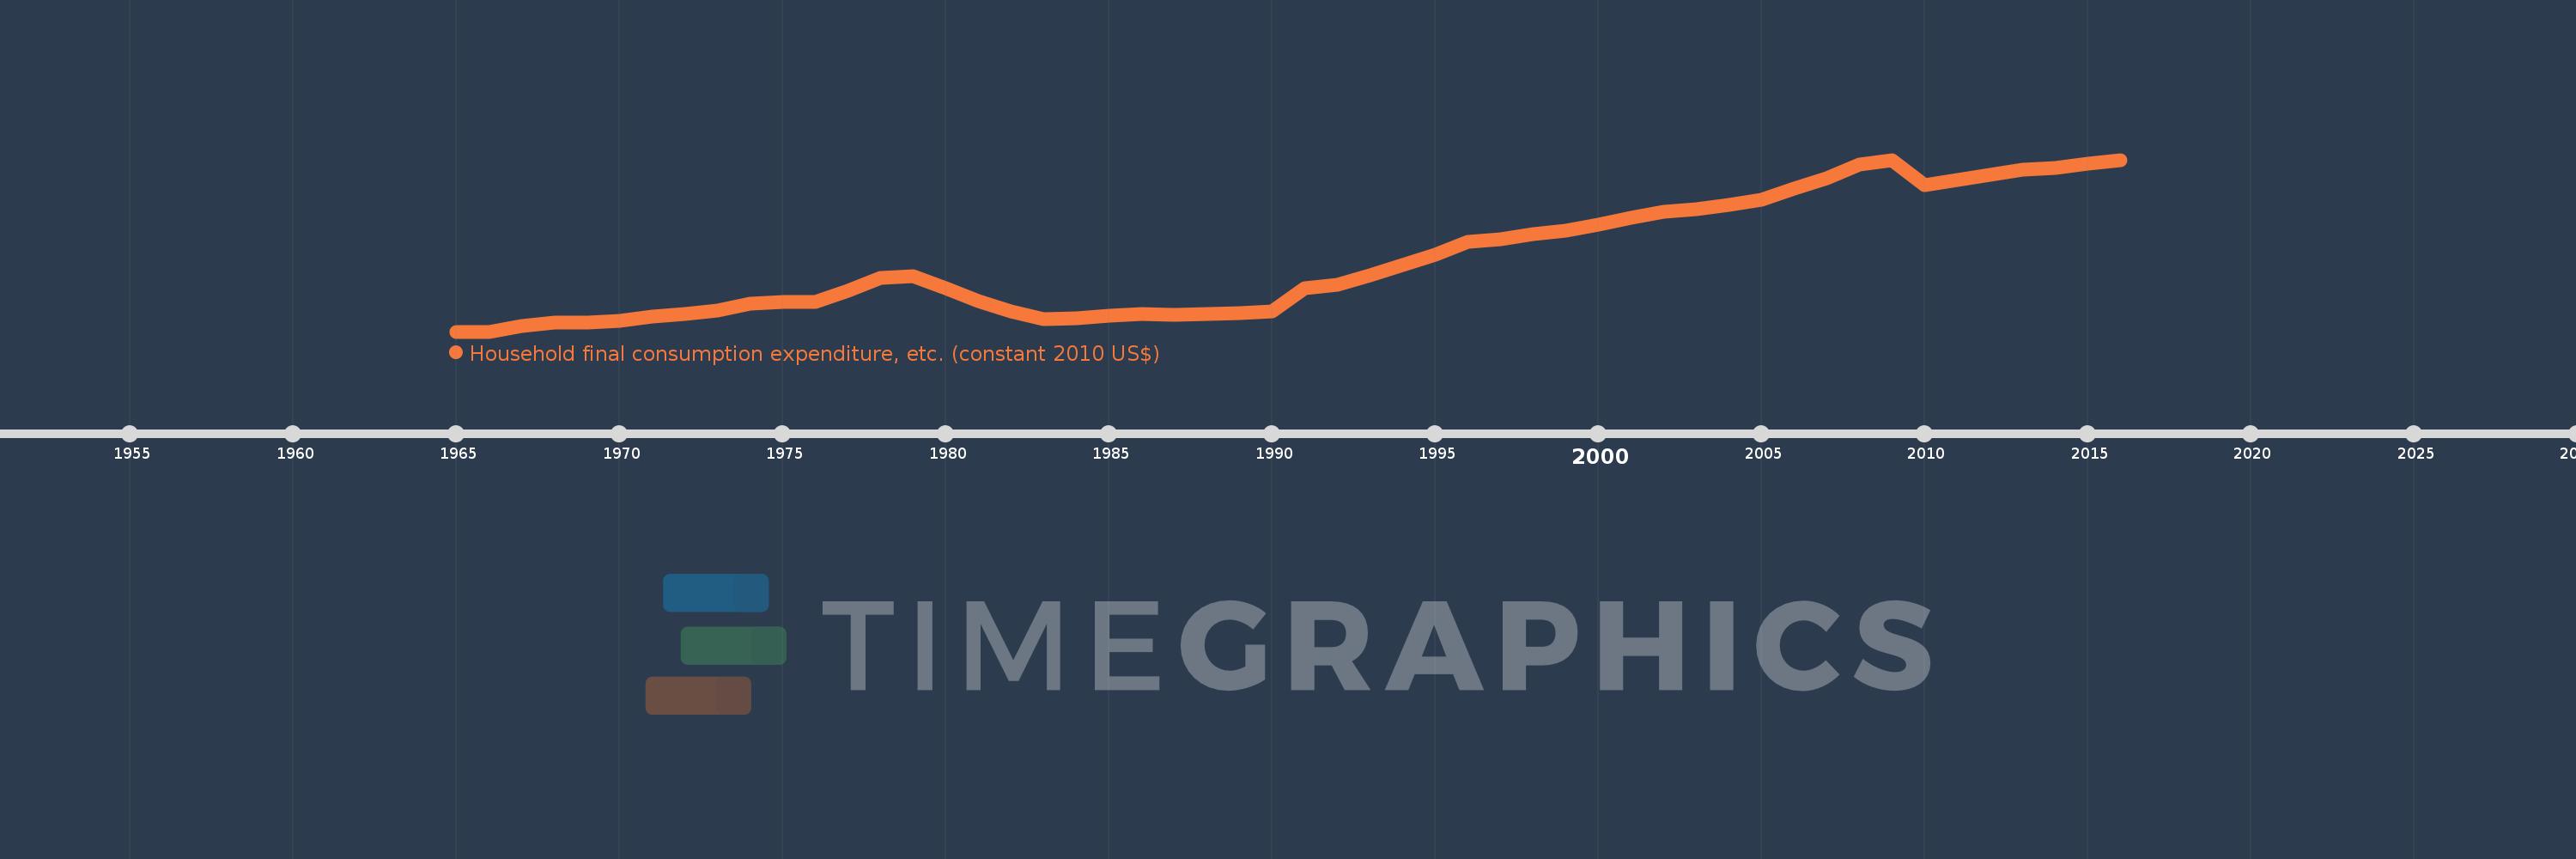
Household final consumption expenditure, etc. (constant 2010 US$)
2016,2015,2014,2013,2012,2011,2010,2009,2008,2007,2006,2005,2004,2003,2002,2001,2000,1999,1998,1997,1996,1995,1994,1993,1992,1991,1990,1989,1988,1987,1986,1985,1984,1983,1982,1981,1980,1979,1978,1977,1976,1975,1974,1973,1972,1971,1970,1969,1968,1967,1966,1965
This statistics in other country:
AfghanistanAlbaniaAlgeriaAngolaAntigua and BarbudaArab WorldArgentinaArmeniaArubaAustraliaAustriaAzerbaijanBahamas, TheBahrainBangladeshBarbadosBelarusBelgiumBelizeBeninBermudaBhutanBoliviaBosnia and HerzegovinaBotswanaBrazilBrunei DarussalamBulgariaBurkina FasoBurundiCabo VerdeCambodiaCameroonCanadaCaribbean small statesCentral African RepublicCentral Europe and the BalticsChadChileChinaColombiaComorosCongo, Dem. Rep.Congo, Rep.Cote d'IvoireCroatiaCubaCyprusCzech RepublicDenmarkDominicaDominican RepublicEarly-demographic dividendEast Asia & PacificEast Asia & Pacific (excluding high income)East Asia & Pacific (IDA & IBRD countries)EcuadorEgypt, Arab Rep.El SalvadorEquatorial GuineaEritreaEstoniaEuro areaEurope & Central AsiaEurope & Central Asia (excluding high income)Europe & Central Asia (IDA & IBRD countries)European UnionFaroe IslandsFinlandFragile and conflict affected situationsFranceGabonGambia, TheGeorgiaGermanyGhanaGreeceGrenadaGuatemalaGuineaGuinea-BissauGuyanaHaitiHeavily indebted poor countries (HIPC)High incomeHondurasHong Kong SAR, ChinaHungaryIBRD onlyIcelandIDA & IBRD totalIDA blendIDA onlyIDA totalIndiaIndonesiaIran, Islamic Rep.IraqIrelandIsraelItalyJamaicaJapanJordanKazakhstanKenyaKorea, Rep.KosovoKuwaitKyrgyz RepublicLao PDRLate-demographic dividendLatin America & Caribbean Latin America & Caribbean (excluding high income)Latin America & the Caribbean (IDA & IBRD countries)LatviaLeast developed countries: UN classificationLebanonLiberiaLithuaniaLow & middle incomeLow incomeLower middle incomeLuxembourgMacao SAR, ChinaMacedonia, FYRMadagascarMalawiMalaysiaMaliMaltaMauritaniaMauritiusMexicoMiddle East & North AfricaMiddle East & North Africa (excluding high income)Middle East & North Africa (IDA & IBRD countries)Middle incomeMoldovaMongoliaMontenegroMoroccoMozambiqueNamibiaNepalNetherlandsNew ZealandNicaraguaNigerNigeriaNorth AmericaNorwayOECD membersOmanOther small statesPakistanPanamaParaguayPeruPhilippinesPolandPortugalPost-demographic dividendPre-demographic dividendPuerto RicoQatarRomaniaRussian FederationRwandaSaudi ArabiaSenegalSerbiaSeychellesSierra LeoneSingaporeSlovak RepublicSloveniaSmall statesSouth AfricaSouth AsiaSouth Asia (IDA & IBRD)South SudanSpainSri LankaSt. Kitts and NevisSt. LuciaSt. Vincent and the GrenadinesSub-Saharan Africa Sub-Saharan Africa (excluding high income)Sub-Saharan Africa (IDA & IBRD countries)SudanSurinameSwazilandSwedenSwitzerlandTajikistanTanzaniaThailandTimor-LesteTogoTongaTrinidad and TobagoTunisiaTurkeyTurkmenistanUgandaUkraineUnited Arab EmiratesUnited KingdomUnited StatesUpper middle incomeUruguayUzbekistanVanuatuVenezuela, RBVietnamWest Bank and GazaWorldYemen, Rep.ZambiaZimbabwe Timeline:
This timeline shows a graph from 1965 to 2016 of El Salvador. No data until 1964. Number of actual observations by date: 52.
Source name:
World Development Indicators
Source organization:
World Bank national accounts data, and OECD National Accounts data files.
Categories, topics:
Economy & Growth
Last updated:
apr 23, 2017
Indicators value changes by year
Minimum:
6.046 bln
jan 1, 1965
Maximum:
21.757 bln
jan 1, 2016
At the date of observation
Value
Absolute change
Change from previous value
jan 1, 1965
6.046 bln
+6.046 bln
0.0%
jan 1, 1966
6.046 bln
0.0
0.0%
jan 1, 1967
6.559 bln
+512.96 mln
8.48%
jan 1, 1968
6.866 bln
+307.227 mln
4.68%
jan 1, 1969
6.908 bln
+42.176 mln
0.61%
jan 1, 1970
7.012 bln
+103.837 mln
1.5%
jan 1, 1971
7.432 bln
+419.667 mln
5.98%
jan 1, 1972
7.661 bln
+229.041 mln
3.08%
jan 1, 1973
7.995 bln
+333.772 mln
4.36%
jan 1, 1974
8.56 bln
+565.495 mln
7.07%
jan 1, 1975
8.724 bln
+163.957 mln
1.92%
jan 1, 1976
8.776 bln
+51.888 mln
0.59%
jan 1, 1977
9.749 bln
+972.829 mln
11.09%
jan 1, 1978
10.976 bln
+1.227 bln
12.59%
jan 1, 1979
11.109 bln
+132.973 mln
1.21%
jan 1, 1980
9.988 bln
-1.121 bln
-10.09%
jan 1, 1981
8.873 bln
-1.115 bln
-11.17%
jan 1, 1982
7.91 bln
-962.994 mln
-10.85%
jan 1, 1983
7.182 bln
-727.232 mln
-9.19%
jan 1, 1984
7.273 bln
+90.981 mln
1.27%
jan 1, 1985
7.481 bln
+207.275 mln
2.85%
jan 1, 1986
7.636 bln
+155.756 mln
2.08%
jan 1, 1987
7.584 bln
-52.781 mln
-0.69%
jan 1, 1988
7.619 bln
+35.301 mln
0.47%
jan 1, 1989
7.723 bln
+103.714 mln
1.36%
jan 1, 1990
7.87 bln
+147.154 mln
1.91%
jan 1, 1991
10.0 bln
+2.13 bln
27.07%
jan 1, 1992
10.304 bln
+304.376 mln
3.04%
jan 1, 1993
11.159 bln
+854.549 mln
8.29%
jan 1, 1994
12.096 bln
+936.559 mln
8.39%
jan 1, 1995
13.058 bln
+962.099 mln
7.95%
jan 1, 1996
14.275 bln
+1.217 bln
9.32%
jan 1, 1997
14.493 bln
+218.148 mln
1.53%
jan 1, 1998
14.932 bln
+439.107 mln
3.03%
jan 1, 1999
15.288 bln
+355.691 mln
2.38%
jan 1, 2000
15.854 bln
+566.809 mln
3.71%
jan 1, 2001
16.476 bln
+621.17 mln
3.92%
jan 1, 2002
16.991 bln
+515.025 mln
3.13%
jan 1, 2003
17.264 bln
+272.978 mln
1.61%
jan 1, 2004
17.618 bln
+354.754 mln
2.05%
jan 1, 2005
18.129 bln
+510.573 mln
2.9%
jan 1, 2006
19.091 bln
+961.865 mln
5.31%
jan 1, 2007
20.038 bln
+947.103 mln
4.96%
jan 1, 2008
21.301 bln
+1.263 bln
6.31%
jan 1, 2009
21.69 bln
+388.495 mln
1.82%
jan 1, 2010
19.462 bln
-2.227 bln
-10.27%
jan 1, 2011
19.897 bln
+434.421 mln
2.23%
jan 1, 2012
20.371 bln
+474.489 mln
2.38%
jan 1, 2013
20.859 bln
+487.845 mln
2.39%
jan 1, 2014
21.014 bln
+154.414 mln
0.74%
jan 1, 2015
21.387 bln
+373.733 mln
1.78%
jan 1, 2016
21.757 bln
+369.281 mln
1.73%
Ranking of countries by current statistics by years


Comments: