29
/
en
AIzaSyAYiBZKx7MnpbEhh9jyipgxe19OcubqV5w
April 1, 2024
240546
Singapore
SGP
true
2
1
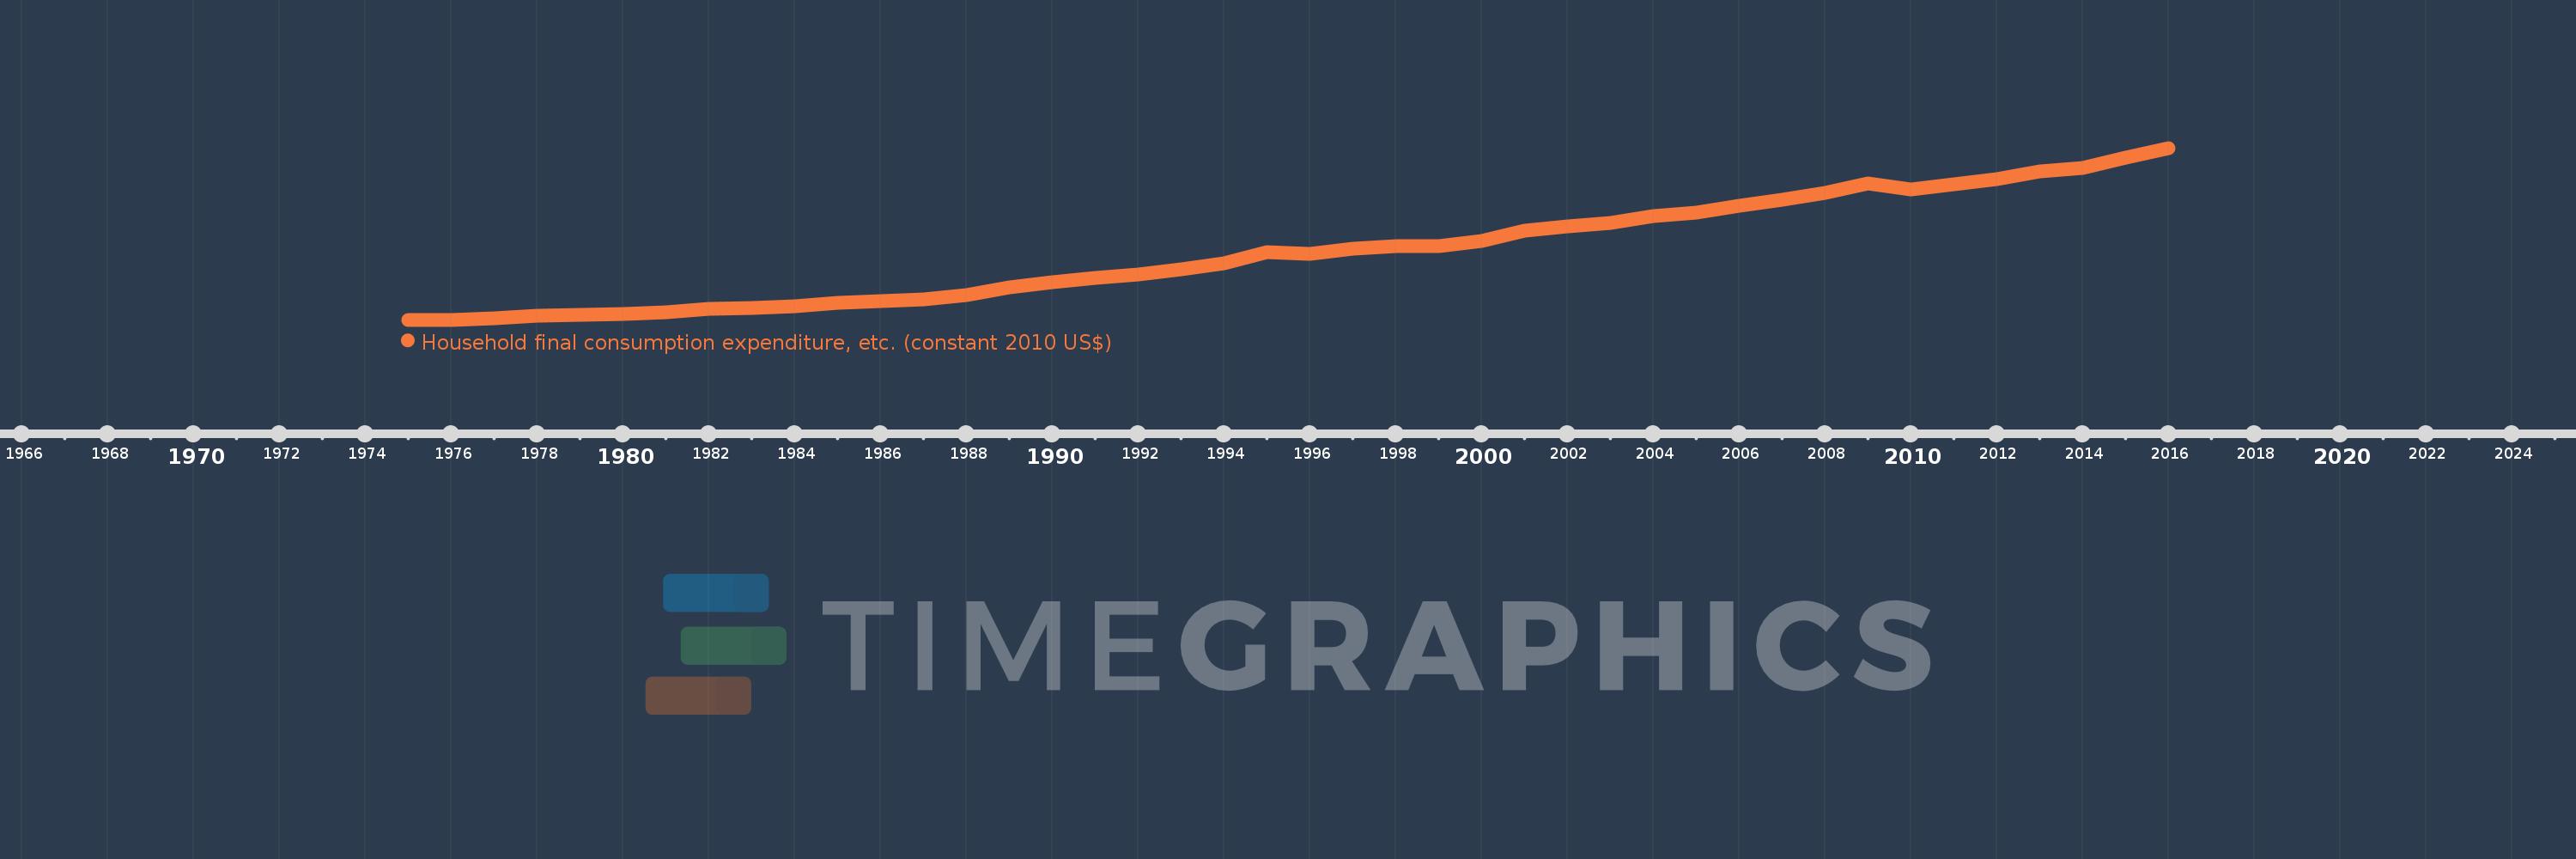
Household final consumption expenditure, etc. (constant 2010 US$)
2016,2015,2014,2013,2012,2011,2010,2009,2008,2007,2006,2005,2004,2003,2002,2001,2000,1999,1998,1997,1996,1995,1994,1993,1992,1991,1990,1989,1988,1987,1986,1985,1984,1983,1982,1981,1980,1979,1978,1977,1976,1975
This statistics in other country:
AfghanistanAlbaniaAlgeriaAngolaAntigua and BarbudaArab WorldArgentinaArmeniaArubaAustraliaAustriaAzerbaijanBahamas, TheBahrainBangladeshBarbadosBelarusBelgiumBelizeBeninBermudaBhutanBoliviaBosnia and HerzegovinaBotswanaBrazilBrunei DarussalamBulgariaBurkina FasoBurundiCabo VerdeCambodiaCameroonCanadaCaribbean small statesCentral African RepublicCentral Europe and the BalticsChadChileChinaColombiaComorosCongo, Dem. Rep.Congo, Rep.Cote d'IvoireCroatiaCubaCyprusCzech RepublicDenmarkDominicaDominican RepublicEarly-demographic dividendEast Asia & PacificEast Asia & Pacific (excluding high income)East Asia & Pacific (IDA & IBRD countries)EcuadorEgypt, Arab Rep.El SalvadorEquatorial GuineaEritreaEstoniaEuro areaEurope & Central AsiaEurope & Central Asia (excluding high income)Europe & Central Asia (IDA & IBRD countries)European UnionFaroe IslandsFinlandFragile and conflict affected situationsFranceGabonGambia, TheGeorgiaGermanyGhanaGreeceGrenadaGuatemalaGuineaGuinea-BissauGuyanaHaitiHeavily indebted poor countries (HIPC)High incomeHondurasHong Kong SAR, ChinaHungaryIBRD onlyIcelandIDA & IBRD totalIDA blendIDA onlyIDA totalIndiaIndonesiaIran, Islamic Rep.IraqIrelandIsraelItalyJamaicaJapanJordanKazakhstanKenyaKorea, Rep.KosovoKuwaitKyrgyz RepublicLao PDRLate-demographic dividendLatin America & Caribbean Latin America & Caribbean (excluding high income)Latin America & the Caribbean (IDA & IBRD countries)LatviaLeast developed countries: UN classificationLebanonLiberiaLithuaniaLow & middle incomeLow incomeLower middle incomeLuxembourgMacao SAR, ChinaMacedonia, FYRMadagascarMalawiMalaysiaMaliMaltaMauritaniaMauritiusMexicoMiddle East & North AfricaMiddle East & North Africa (excluding high income)Middle East & North Africa (IDA & IBRD countries)Middle incomeMoldovaMongoliaMontenegroMoroccoMozambiqueNamibiaNepalNetherlandsNew ZealandNicaraguaNigerNigeriaNorth AmericaNorwayOECD membersOmanOther small statesPakistanPanamaParaguayPeruPhilippinesPolandPortugalPost-demographic dividendPre-demographic dividendPuerto RicoQatarRomaniaRussian FederationRwandaSaudi ArabiaSenegalSerbiaSeychellesSierra LeoneSingaporeSlovak RepublicSloveniaSmall statesSouth AfricaSouth AsiaSouth Asia (IDA & IBRD)South SudanSpainSri LankaSt. Kitts and NevisSt. LuciaSt. Vincent and the GrenadinesSub-Saharan Africa Sub-Saharan Africa (excluding high income)Sub-Saharan Africa (IDA & IBRD countries)SudanSurinameSwazilandSwedenSwitzerlandTajikistanTanzaniaThailandTimor-LesteTogoTongaTrinidad and TobagoTunisiaTurkeyTurkmenistanUgandaUkraineUnited Arab EmiratesUnited KingdomUnited StatesUpper middle incomeUruguayUzbekistanVanuatuVenezuela, RBVietnamWest Bank and GazaWorldYemen, Rep.ZambiaZimbabwe Timeline:
This timeline shows a graph from 1975 to 2016 of Singapore. No data until 1974. Number of actual observations by date: 42.
Source name:
World Development Indicators
Source organization:
World Bank national accounts data, and OECD National Accounts data files.
Categories, topics:
Economy & Growth
Last updated:
apr 23, 2017
Indicators value changes by year
Minimum:
9.936 bln
jan 1, 1975
Maximum:
103.626 bln
jan 1, 2016
At the date of observation
Value
Absolute change
Change from previous value
jan 1, 1975
9.936 bln
+9.936 bln
0.0%
jan 1, 1976
9.936 bln
0.0
0.0%
jan 1, 1977
10.724 bln
+788.706 mln
7.94%
jan 1, 1978
11.935 bln
+1.211 bln
11.29%
jan 1, 1979
12.757 bln
+821.709 mln
6.88%
jan 1, 1980
13.265 bln
+508.691 mln
3.99%
jan 1, 1981
13.969 bln
+703.85 mln
5.31%
jan 1, 1982
15.893 bln
+1.923 bln
13.77%
jan 1, 1983
16.459 bln
+565.97 mln
3.56%
jan 1, 1984
17.492 bln
+1.034 bln
6.28%
jan 1, 1985
19.187 bln
+1.694 bln
9.69%
jan 1, 1986
19.937 bln
+749.835 mln
3.91%
jan 1, 1987
20.829 bln
+892.483 mln
4.48%
jan 1, 1988
23.562 bln
+2.733 bln
13.12%
jan 1, 1989
27.385 bln
+3.823 bln
16.22%
jan 1, 1990
30.242 bln
+2.857 bln
10.43%
jan 1, 1991
32.517 bln
+2.274 bln
7.52%
jan 1, 1992
34.734 bln
+2.218 bln
6.82%
jan 1, 1993
37.404 bln
+2.669 bln
7.68%
jan 1, 1994
40.925 bln
+3.521 bln
9.41%
jan 1, 1995
46.684 bln
+5.759 bln
14.07%
jan 1, 1996
46.075 bln
-609.094 mln
-1.3%
jan 1, 1997
48.616 bln
+2.541 bln
5.51%
jan 1, 1998
50.176 bln
+1.56 bln
3.21%
jan 1, 1999
50.147 bln
-28.456 mln
-0.06%
jan 1, 2000
52.904 bln
+2.757 bln
5.5%
jan 1, 2001
58.409 bln
+5.505 bln
10.4%
jan 1, 2002
60.762 bln
+2.354 bln
4.03%
jan 1, 2003
62.546 bln
+1.783 bln
2.94%
jan 1, 2004
66.662 bln
+4.117 bln
6.58%
jan 1, 2005
68.32 bln
+1.658 bln
2.49%
jan 1, 2006
72.193 bln
+3.872 bln
5.67%
jan 1, 2007
75.598 bln
+3.405 bln
4.72%
jan 1, 2008
78.931 bln
+3.333 bln
4.41%
jan 1, 2009
84.481 bln
+5.55 bln
7.03%
jan 1, 2010
80.849 bln
-3.632 bln
-4.3%
jan 1, 2011
83.989 bln
+3.14 bln
3.88%
jan 1, 2012
86.805 bln
+2.817 bln
3.35%
jan 1, 2013
90.73 bln
+3.925 bln
4.52%
jan 1, 2014
92.519 bln
+1.789 bln
1.97%
jan 1, 2015
98.294 bln
+5.775 bln
6.24%
jan 1, 2016
103.626 bln
+5.332 bln
5.42%
Ranking of countries by current statistics by years


Comments: