29
/
en
AIzaSyAYiBZKx7MnpbEhh9jyipgxe19OcubqV5w
April 1, 2024
54854
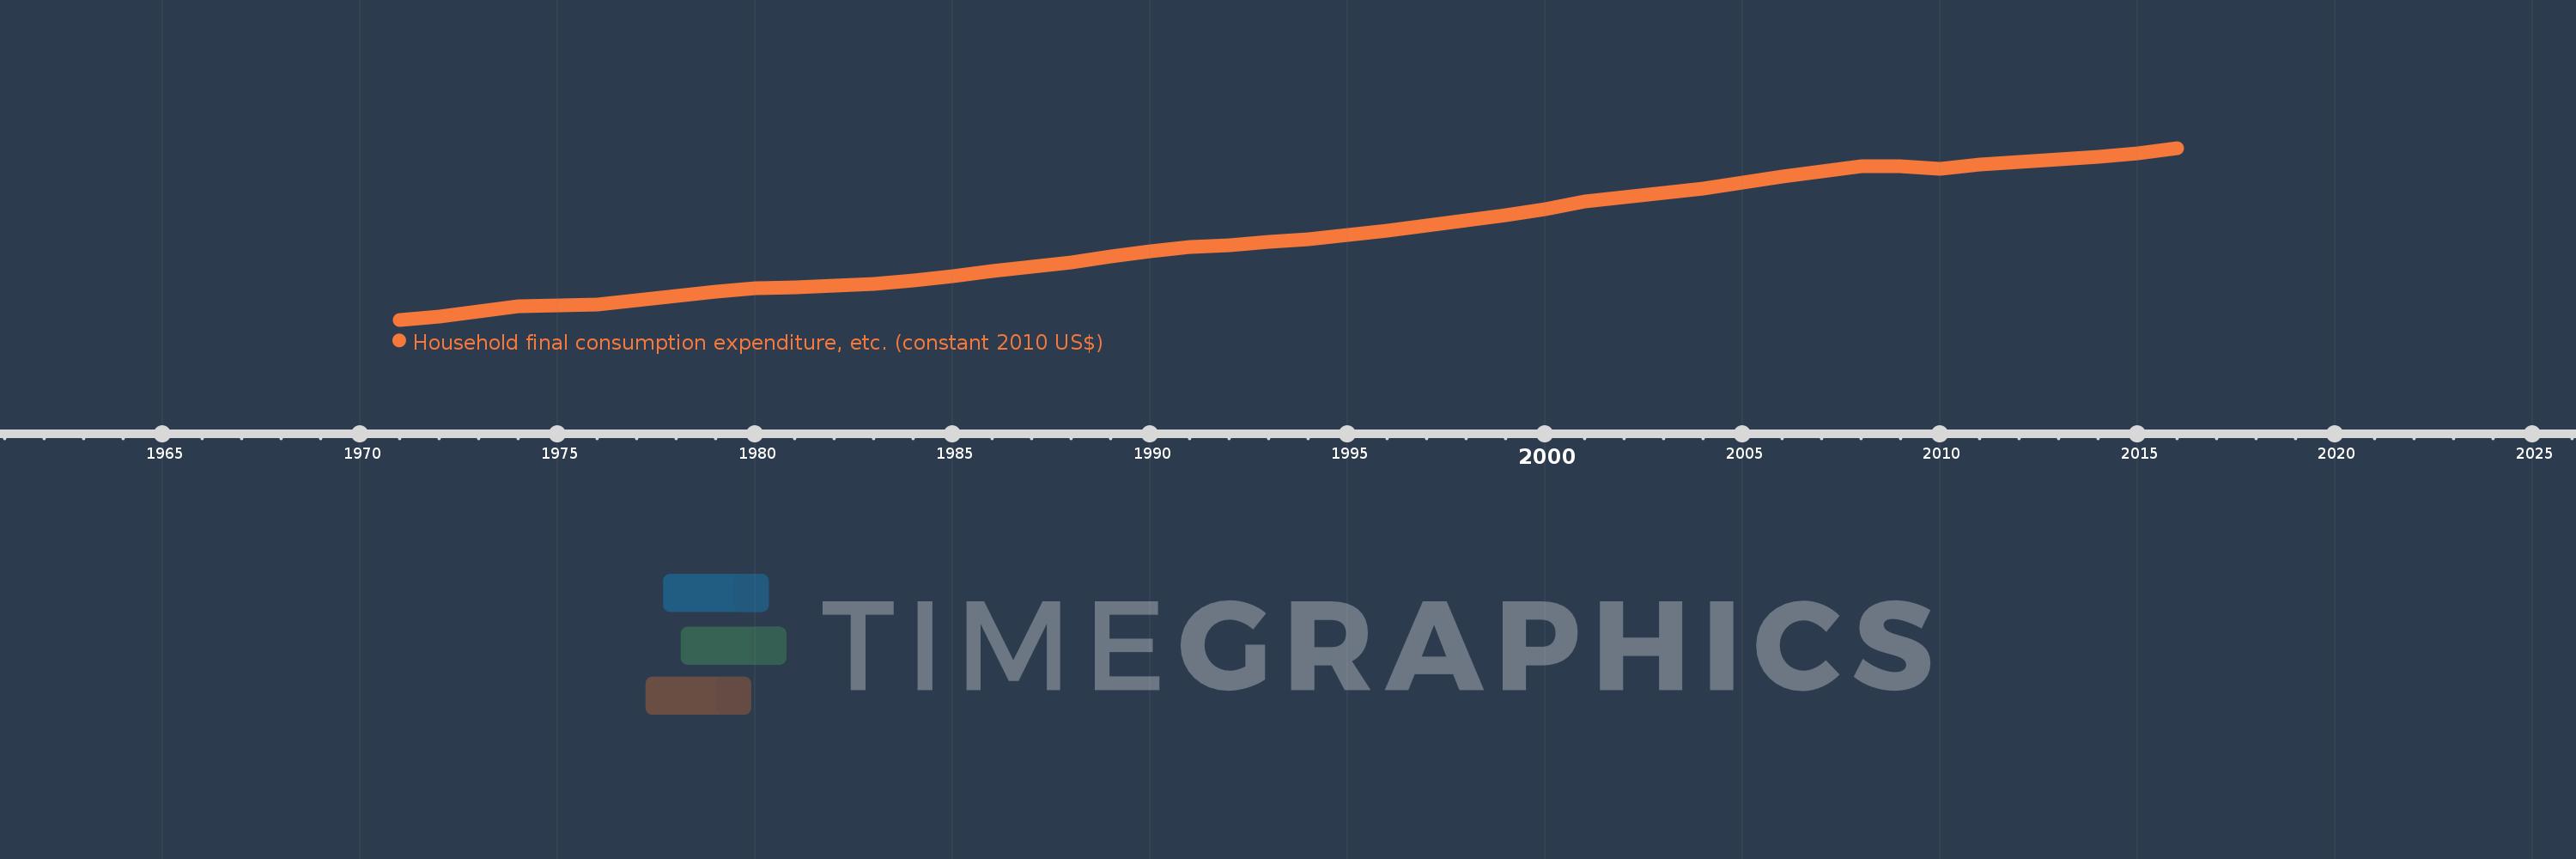
Post-demographic dividend
PST
false
2
1
Household final consumption expenditure, etc. (constant 2010 US$)
2016,2015,2014,2013,2012,2011,2010,2009,2008,2007,2006,2005,2004,2003,2002,2001,2000,1999,1998,1997,1996,1995,1994,1993,1992,1991,1990,1989,1988,1987,1986,1985,1984,1983,1982,1981,1980,1979,1978,1977,1976,1975,1974,1973,1972,1971
This statistics in other country:
AfghanistanAlbaniaAlgeriaAngolaAntigua and BarbudaArab WorldArgentinaArmeniaArubaAustraliaAustriaAzerbaijanBahamas, TheBahrainBangladeshBarbadosBelarusBelgiumBelizeBeninBermudaBhutanBoliviaBosnia and HerzegovinaBotswanaBrazilBrunei DarussalamBulgariaBurkina FasoBurundiCabo VerdeCambodiaCameroonCanadaCaribbean small statesCentral African RepublicCentral Europe and the BalticsChadChileChinaColombiaComorosCongo, Dem. Rep.Congo, Rep.Cote d'IvoireCroatiaCubaCyprusCzech RepublicDenmarkDominicaDominican RepublicEarly-demographic dividendEast Asia & PacificEast Asia & Pacific (excluding high income)East Asia & Pacific (IDA & IBRD countries)EcuadorEgypt, Arab Rep.El SalvadorEquatorial GuineaEritreaEstoniaEuro areaEurope & Central AsiaEurope & Central Asia (excluding high income)Europe & Central Asia (IDA & IBRD countries)European UnionFaroe IslandsFinlandFragile and conflict affected situationsFranceGabonGambia, TheGeorgiaGermanyGhanaGreeceGrenadaGuatemalaGuineaGuinea-BissauGuyanaHaitiHeavily indebted poor countries (HIPC)High incomeHondurasHong Kong SAR, ChinaHungaryIBRD onlyIcelandIDA & IBRD totalIDA blendIDA onlyIDA totalIndiaIndonesiaIran, Islamic Rep.IraqIrelandIsraelItalyJamaicaJapanJordanKazakhstanKenyaKorea, Rep.KosovoKuwaitKyrgyz RepublicLao PDRLate-demographic dividendLatin America & Caribbean Latin America & Caribbean (excluding high income)Latin America & the Caribbean (IDA & IBRD countries)LatviaLeast developed countries: UN classificationLebanonLiberiaLithuaniaLow & middle incomeLow incomeLower middle incomeLuxembourgMacao SAR, ChinaMacedonia, FYRMadagascarMalawiMalaysiaMaliMaltaMauritaniaMauritiusMexicoMiddle East & North AfricaMiddle East & North Africa (excluding high income)Middle East & North Africa (IDA & IBRD countries)Middle incomeMoldovaMongoliaMontenegroMoroccoMozambiqueNamibiaNepalNetherlandsNew ZealandNicaraguaNigerNigeriaNorth AmericaNorwayOECD membersOmanOther small statesPakistanPanamaParaguayPeruPhilippinesPolandPortugalPost-demographic dividendPre-demographic dividendPuerto RicoQatarRomaniaRussian FederationRwandaSaudi ArabiaSenegalSerbiaSeychellesSierra LeoneSingaporeSlovak RepublicSloveniaSmall statesSouth AfricaSouth AsiaSouth Asia (IDA & IBRD)South SudanSpainSri LankaSt. Kitts and NevisSt. LuciaSt. Vincent and the GrenadinesSub-Saharan Africa Sub-Saharan Africa (excluding high income)Sub-Saharan Africa (IDA & IBRD countries)SudanSurinameSwazilandSwedenSwitzerlandTajikistanTanzaniaThailandTimor-LesteTogoTongaTrinidad and TobagoTunisiaTurkeyTurkmenistanUgandaUkraineUnited Arab EmiratesUnited KingdomUnited StatesUpper middle incomeUruguayUzbekistanVanuatuVenezuela, RBVietnamWest Bank and GazaWorldYemen, Rep.ZambiaZimbabwe Timeline:
This timeline shows a graph from 1971 to 2016 of Post-demographic dividend. No data until 1970. Number of actual observations by date: 46.
Source name:
World Development Indicators
Source organization:
World Bank national accounts data, and OECD National Accounts data files.
Categories, topics:
Economy & Growth
Last updated:
apr 23, 2017
Indicators value changes by year
Minimum:
8.195 trl
jan 1, 1971
Maximum:
27.555 trl
jan 1, 2016
At the date of observation
Value
Absolute change
Change from previous value
jan 1, 1971
8.195 trl
+8.195 trl
0.0%
jan 1, 1972
8.58 trl
+384.808 bln
4.7%
jan 1, 1973
9.145 trl
+564.787 bln
6.58%
jan 1, 1974
9.704 trl
+559.207 bln
6.12%
jan 1, 1975
9.785 trl
+81.153 bln
0.84%
jan 1, 1976
9.944 trl
+159.184 bln
1.63%
jan 1, 1977
10.417 trl
+472.6 bln
4.75%
jan 1, 1978
10.836 trl
+418.64 bln
4.02%
jan 1, 1979
11.314 trl
+478.501 bln
4.42%
jan 1, 1980
11.749 trl
+435.189 bln
3.85%
jan 1, 1981
11.859 trl
+109.789 bln
0.93%
jan 1, 1982
12.081 trl
+222.255 bln
1.87%
jan 1, 1983
12.217 trl
+136.064 bln
1.13%
jan 1, 1984
12.635 trl
+417.806 bln
3.42%
jan 1, 1985
13.128 trl
+492.886 bln
3.9%
jan 1, 1986
13.656 trl
+528.022 bln
4.02%
jan 1, 1987
14.138 trl
+481.962 bln
3.53%
jan 1, 1988
14.672 trl
+534.048 bln
3.78%
jan 1, 1989
15.331 trl
+658.908 bln
4.49%
jan 1, 1990
15.91 trl
+579.282 bln
3.78%
jan 1, 1991
16.359 trl
+448.992 bln
2.82%
jan 1, 1992
16.548 trl
+189.004 bln
1.16%
jan 1, 1993
16.961 trl
+412.293 bln
2.49%
jan 1, 1994
17.232 trl
+271.692 bln
1.6%
jan 1, 1995
17.772 trl
+540.211 bln
3.13%
jan 1, 1996
18.226 trl
+453.101 bln
2.55%
jan 1, 1997
18.787 trl
+561.033 bln
3.08%
jan 1, 1998
19.352 trl
+565.523 bln
3.01%
jan 1, 1999
19.94 trl
+587.682 bln
3.04%
jan 1, 2000
20.69 trl
+750.654 bln
3.76%
jan 1, 2001
21.494 trl
+803.34 bln
3.88%
jan 1, 2002
21.985 trl
+491.547 bln
2.29%
jan 1, 2003
22.469 trl
+483.396 bln
2.2%
jan 1, 2004
22.956 trl
+487.49 bln
2.17%
jan 1, 2005
23.629 trl
+673.0 bln
2.93%
jan 1, 2006
24.311 trl
+681.652 bln
2.88%
jan 1, 2007
24.945 trl
+633.941 bln
2.61%
jan 1, 2008
25.508 trl
+563.066 bln
2.26%
jan 1, 2009
25.54 trl
+31.874 bln
0.12%
jan 1, 2010
25.199 trl
-340.569 bln
-1.33%
jan 1, 2011
25.664 trl
+464.797 bln
1.84%
jan 1, 2012
26.0 trl
+336.162 bln
1.31%
jan 1, 2013
26.259 trl
+259.074 bln
1.0%
jan 1, 2014
26.542 trl
+282.299 bln
1.08%
jan 1, 2015
26.972 trl
+430.631 bln
1.62%
jan 1, 2016
27.555 trl
+582.391 bln
2.16%
Ranking of countries by current statistics by years


Comments: