29
/
en
AIzaSyAYiBZKx7MnpbEhh9jyipgxe19OcubqV5w
April 1, 2024
109772
Congo, Dem. Rep.
COD
true
2
1
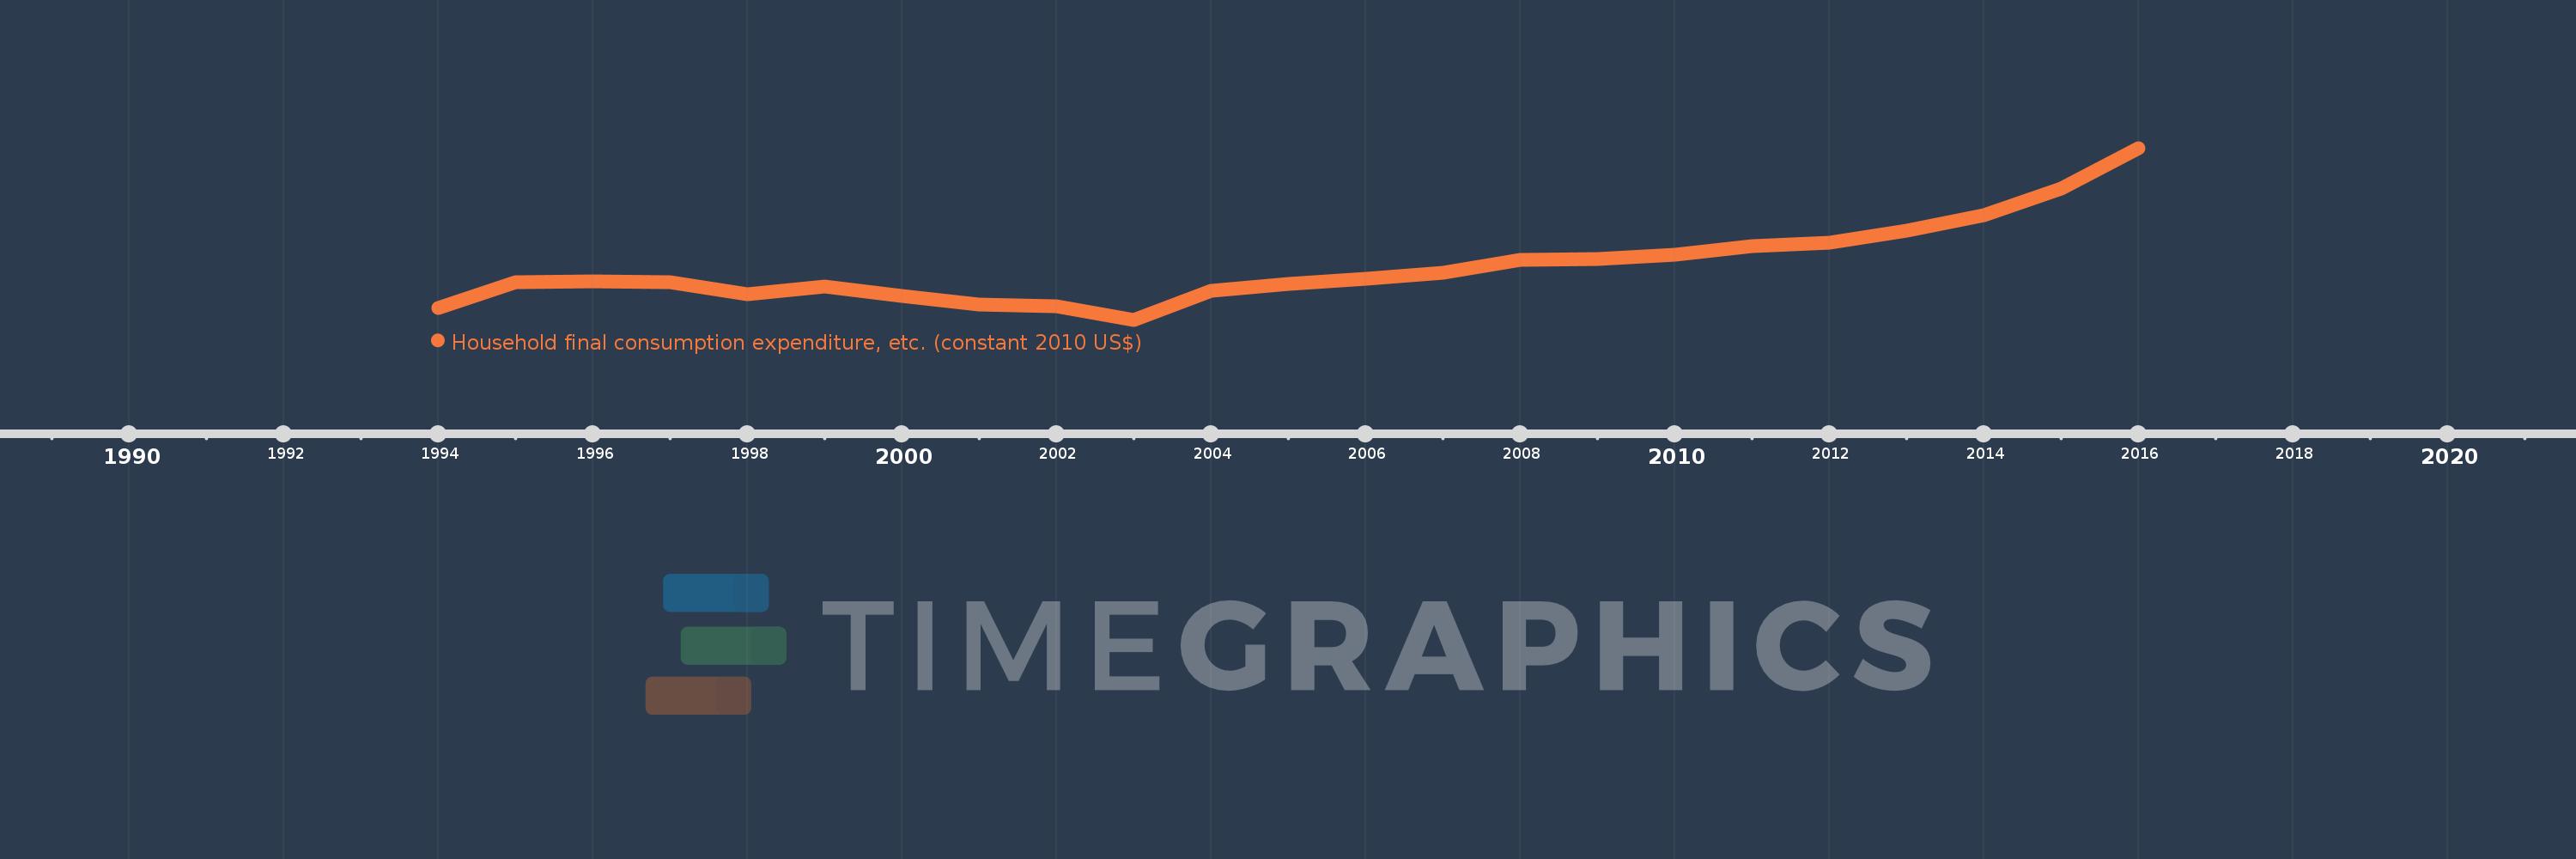
Household final consumption expenditure, etc. (constant 2010 US$)
2016,2015,2014,2013,2012,2011,2010,2009,2008,2007,2006,2005,2004,2003,2002,2001,2000,1999,1998,1997,1996,1995,1994
This statistics in other country:
AfghanistanAlbaniaAlgeriaAngolaAntigua and BarbudaArab WorldArgentinaArmeniaArubaAustraliaAustriaAzerbaijanBahamas, TheBahrainBangladeshBarbadosBelarusBelgiumBelizeBeninBermudaBhutanBoliviaBosnia and HerzegovinaBotswanaBrazilBrunei DarussalamBulgariaBurkina FasoBurundiCabo VerdeCambodiaCameroonCanadaCaribbean small statesCentral African RepublicCentral Europe and the BalticsChadChileChinaColombiaComorosCongo, Dem. Rep.Congo, Rep.Cote d'IvoireCroatiaCubaCyprusCzech RepublicDenmarkDominicaDominican RepublicEarly-demographic dividendEast Asia & PacificEast Asia & Pacific (excluding high income)East Asia & Pacific (IDA & IBRD countries)EcuadorEgypt, Arab Rep.El SalvadorEquatorial GuineaEritreaEstoniaEuro areaEurope & Central AsiaEurope & Central Asia (excluding high income)Europe & Central Asia (IDA & IBRD countries)European UnionFaroe IslandsFinlandFragile and conflict affected situationsFranceGabonGambia, TheGeorgiaGermanyGhanaGreeceGrenadaGuatemalaGuineaGuinea-BissauGuyanaHaitiHeavily indebted poor countries (HIPC)High incomeHondurasHong Kong SAR, ChinaHungaryIBRD onlyIcelandIDA & IBRD totalIDA blendIDA onlyIDA totalIndiaIndonesiaIran, Islamic Rep.IraqIrelandIsraelItalyJamaicaJapanJordanKazakhstanKenyaKorea, Rep.KosovoKuwaitKyrgyz RepublicLao PDRLate-demographic dividendLatin America & Caribbean Latin America & Caribbean (excluding high income)Latin America & the Caribbean (IDA & IBRD countries)LatviaLeast developed countries: UN classificationLebanonLiberiaLithuaniaLow & middle incomeLow incomeLower middle incomeLuxembourgMacao SAR, ChinaMacedonia, FYRMadagascarMalawiMalaysiaMaliMaltaMauritaniaMauritiusMexicoMiddle East & North AfricaMiddle East & North Africa (excluding high income)Middle East & North Africa (IDA & IBRD countries)Middle incomeMoldovaMongoliaMontenegroMoroccoMozambiqueNamibiaNepalNetherlandsNew ZealandNicaraguaNigerNigeriaNorth AmericaNorwayOECD membersOmanOther small statesPakistanPanamaParaguayPeruPhilippinesPolandPortugalPost-demographic dividendPre-demographic dividendPuerto RicoQatarRomaniaRussian FederationRwandaSaudi ArabiaSenegalSerbiaSeychellesSierra LeoneSingaporeSlovak RepublicSloveniaSmall statesSouth AfricaSouth AsiaSouth Asia (IDA & IBRD)South SudanSpainSri LankaSt. Kitts and NevisSt. LuciaSt. Vincent and the GrenadinesSub-Saharan Africa Sub-Saharan Africa (excluding high income)Sub-Saharan Africa (IDA & IBRD countries)SudanSurinameSwazilandSwedenSwitzerlandTajikistanTanzaniaThailandTimor-LesteTogoTongaTrinidad and TobagoTunisiaTurkeyTurkmenistanUgandaUkraineUnited Arab EmiratesUnited KingdomUnited StatesUpper middle incomeUruguayUzbekistanVanuatuVenezuela, RBVietnamWest Bank and GazaWorldYemen, Rep.ZambiaZimbabwe Timeline:
This timeline shows a graph from 1994 to 2016 of Congo, Dem. Rep.. No data until 1993. Number of actual observations by date: 23.
Source name:
World Development Indicators
Source organization:
World Bank national accounts data, and OECD National Accounts data files.
Categories, topics:
Economy & Growth
Last updated:
apr 23, 2017
Indicators value changes by year
Minimum:
10.294 bln
jan 1, 2003
Maximum:
24.651 bln
jan 1, 2016
At the date of observation
Value
Absolute change
Change from previous value
jan 1, 1994
11.293 bln
+11.293 bln
0.0%
jan 1, 1995
13.46 bln
+2.167 bln
19.19%
jan 1, 1996
13.508 bln
+47.87 mln
0.36%
jan 1, 1997
13.448 bln
-59.761 mln
-0.44%
jan 1, 1998
12.441 bln
-1.007 bln
-7.49%
jan 1, 1999
13.106 bln
+665.133 mln
5.35%
jan 1, 2000
12.286 bln
-819.746 mln
-6.25%
jan 1, 2001
11.595 bln
-691.21 mln
-5.63%
jan 1, 2002
11.429 bln
-166.354 mln
-1.43%
jan 1, 2003
10.294 bln
-1.135 bln
-9.93%
jan 1, 2004
12.724 bln
+2.43 bln
23.61%
jan 1, 2005
13.309 bln
+585.562 mln
4.6%
jan 1, 2006
13.709 bln
+399.69 mln
3.0%
jan 1, 2007
14.256 bln
+547.426 mln
3.99%
jan 1, 2008
15.303 bln
+1.046 bln
7.34%
jan 1, 2009
15.389 bln
+86.688 mln
0.57%
jan 1, 2010
15.734 bln
+344.39 mln
2.24%
jan 1, 2011
16.447 bln
+713.782 mln
4.54%
jan 1, 2012
16.749 bln
+301.374 mln
1.83%
jan 1, 2013
17.74 bln
+990.691 mln
5.91%
jan 1, 2014
19.056 bln
+1.317 bln
7.42%
jan 1, 2015
21.254 bln
+2.198 bln
11.53%
jan 1, 2016
24.651 bln
+3.397 bln
15.98%
Ranking of countries by current statistics by years


Comments: