29
/
en
AIzaSyAYiBZKx7MnpbEhh9jyipgxe19OcubqV5w
April 1, 2024
277777
Uruguay
URY
true
2
1
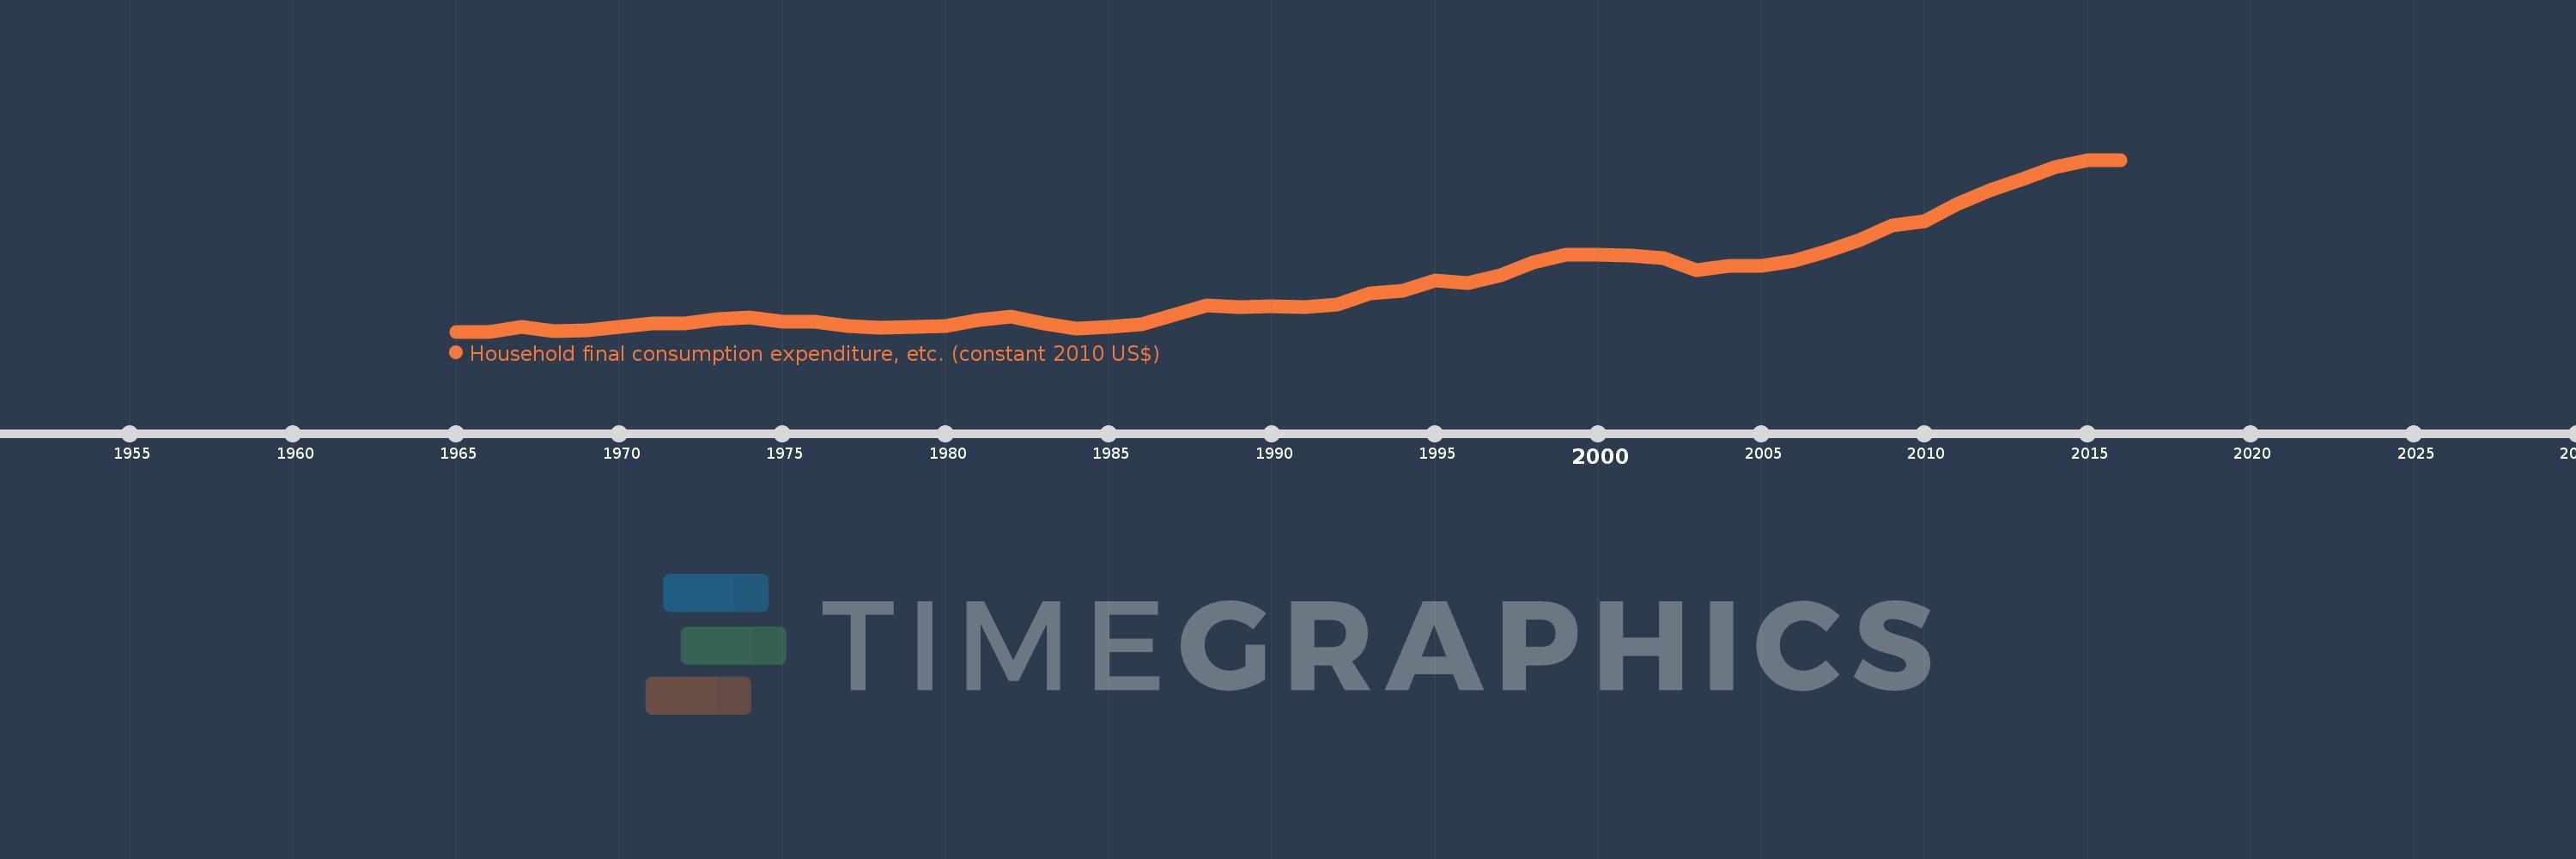
Household final consumption expenditure, etc. (constant 2010 US$)
2016,2015,2014,2013,2012,2011,2010,2009,2008,2007,2006,2005,2004,2003,2002,2001,2000,1999,1998,1997,1996,1995,1994,1993,1992,1991,1990,1989,1988,1987,1986,1985,1984,1983,1982,1981,1980,1979,1978,1977,1976,1975,1974,1973,1972,1971,1970,1969,1968,1967,1966,1965
This statistics in other country:
AfghanistanAlbaniaAlgeriaAngolaAntigua and BarbudaArab WorldArgentinaArmeniaArubaAustraliaAustriaAzerbaijanBahamas, TheBahrainBangladeshBarbadosBelarusBelgiumBelizeBeninBermudaBhutanBoliviaBosnia and HerzegovinaBotswanaBrazilBrunei DarussalamBulgariaBurkina FasoBurundiCabo VerdeCambodiaCameroonCanadaCaribbean small statesCentral African RepublicCentral Europe and the BalticsChadChileChinaColombiaComorosCongo, Dem. Rep.Congo, Rep.Cote d'IvoireCroatiaCubaCyprusCzech RepublicDenmarkDominicaDominican RepublicEarly-demographic dividendEast Asia & PacificEast Asia & Pacific (excluding high income)East Asia & Pacific (IDA & IBRD countries)EcuadorEgypt, Arab Rep.El SalvadorEquatorial GuineaEritreaEstoniaEuro areaEurope & Central AsiaEurope & Central Asia (excluding high income)Europe & Central Asia (IDA & IBRD countries)European UnionFaroe IslandsFinlandFragile and conflict affected situationsFranceGabonGambia, TheGeorgiaGermanyGhanaGreeceGrenadaGuatemalaGuineaGuinea-BissauGuyanaHaitiHeavily indebted poor countries (HIPC)High incomeHondurasHong Kong SAR, ChinaHungaryIBRD onlyIcelandIDA & IBRD totalIDA blendIDA onlyIDA totalIndiaIndonesiaIran, Islamic Rep.IraqIrelandIsraelItalyJamaicaJapanJordanKazakhstanKenyaKorea, Rep.KosovoKuwaitKyrgyz RepublicLao PDRLate-demographic dividendLatin America & Caribbean Latin America & Caribbean (excluding high income)Latin America & the Caribbean (IDA & IBRD countries)LatviaLeast developed countries: UN classificationLebanonLiberiaLithuaniaLow & middle incomeLow incomeLower middle incomeLuxembourgMacao SAR, ChinaMacedonia, FYRMadagascarMalawiMalaysiaMaliMaltaMauritaniaMauritiusMexicoMiddle East & North AfricaMiddle East & North Africa (excluding high income)Middle East & North Africa (IDA & IBRD countries)Middle incomeMoldovaMongoliaMontenegroMoroccoMozambiqueNamibiaNepalNetherlandsNew ZealandNicaraguaNigerNigeriaNorth AmericaNorwayOECD membersOmanOther small statesPakistanPanamaParaguayPeruPhilippinesPolandPortugalPost-demographic dividendPre-demographic dividendPuerto RicoQatarRomaniaRussian FederationRwandaSaudi ArabiaSenegalSerbiaSeychellesSierra LeoneSingaporeSlovak RepublicSloveniaSmall statesSouth AfricaSouth AsiaSouth Asia (IDA & IBRD)South SudanSpainSri LankaSt. Kitts and NevisSt. LuciaSt. Vincent and the GrenadinesSub-Saharan Africa Sub-Saharan Africa (excluding high income)Sub-Saharan Africa (IDA & IBRD countries)SudanSurinameSwazilandSwedenSwitzerlandTajikistanTanzaniaThailandTimor-LesteTogoTongaTrinidad and TobagoTunisiaTurkeyTurkmenistanUgandaUkraineUnited Arab EmiratesUnited KingdomUnited StatesUpper middle incomeUruguayUzbekistanVanuatuVenezuela, RBVietnamWest Bank and GazaWorldYemen, Rep.ZambiaZimbabwe Timeline:
This timeline shows a graph from 1965 to 2016 of Uruguay. No data until 1964. Number of actual observations by date: 52.
Source name:
World Development Indicators
Source organization:
World Bank national accounts data, and OECD National Accounts data files.
Categories, topics:
Economy & Growth
Last updated:
apr 23, 2017
Indicators value changes by year
Minimum:
9.821 bln
jan 1, 1965
Maximum:
32.962 bln
jan 1, 2016
At the date of observation
Value
Absolute change
Change from previous value
jan 1, 1965
9.821 bln
+9.821 bln
0.0%
jan 1, 1966
9.821 bln
0.0
0.0%
jan 1, 1967
10.447 bln
+626.275 mln
6.38%
jan 1, 1968
9.881 bln
-565.616 mln
-5.41%
jan 1, 1969
9.947 bln
+66.048 mln
0.67%
jan 1, 1970
10.476 bln
+529.065 mln
5.32%
jan 1, 1971
10.869 bln
+392.433 mln
3.75%
jan 1, 1972
10.876 bln
+7.276 mln
0.07%
jan 1, 1973
11.452 bln
+576.266 mln
5.3%
jan 1, 1974
11.702 bln
+249.792 mln
2.18%
jan 1, 1975
11.193 bln
-509.291 mln
-4.35%
jan 1, 1976
11.19 bln
-2.996 mln
-0.03%
jan 1, 1977
10.534 bln
-655.468 mln
-5.86%
jan 1, 1978
10.296 bln
-238.266 mln
-2.26%
jan 1, 1979
10.407 bln
+110.572 mln
1.07%
jan 1, 1980
10.568 bln
+161.215 mln
1.55%
jan 1, 1981
11.402 bln
+833.7 mln
7.89%
jan 1, 1982
11.841 bln
+439.177 mln
3.85%
jan 1, 1983
10.872 bln
-969.197 mln
-8.19%
jan 1, 1984
10.21 bln
-661.332 mln
-6.08%
jan 1, 1985
10.416 bln
+205.61 mln
2.01%
jan 1, 1986
10.852 bln
+436.133 mln
4.19%
jan 1, 1987
12.036 bln
+1.184 bln
10.91%
jan 1, 1988
13.403 bln
+1.367 bln
11.36%
jan 1, 1989
13.071 bln
-331.618 mln
-2.47%
jan 1, 1990
13.289 bln
+217.71 mln
1.67%
jan 1, 1991
13.065 bln
-224.046 mln
-1.69%
jan 1, 1992
13.429 bln
+363.695 mln
2.78%
jan 1, 1993
14.945 bln
+1.517 bln
11.29%
jan 1, 1994
15.364 bln
+418.814 mln
2.8%
jan 1, 1995
16.738 bln
+1.373 bln
8.94%
jan 1, 1996
16.376 bln
-361.339 mln
-2.16%
jan 1, 1997
17.389 bln
+1.013 bln
6.18%
jan 1, 1998
19.094 bln
+1.705 bln
9.81%
jan 1, 1999
20.208 bln
+1.114 bln
5.83%
jan 1, 2000
20.224 bln
+16.204 mln
0.08%
jan 1, 2001
20.118 bln
-106.384 mln
-0.53%
jan 1, 2002
19.694 bln
-423.341 mln
-2.1%
jan 1, 2003
18.133 bln
-1.562 bln
-7.93%
jan 1, 2004
18.618 bln
+485.411 mln
2.68%
jan 1, 2005
18.729 bln
+111.457 mln
0.6%
jan 1, 2006
19.379 bln
+649.992 mln
3.47%
jan 1, 2007
20.63 bln
+1.25 bln
6.45%
jan 1, 2008
22.093 bln
+1.463 bln
7.09%
jan 1, 2009
24.103 bln
+2.009 bln
9.1%
jan 1, 2010
24.656 bln
+553.741 mln
2.3%
jan 1, 2011
26.974 bln
+2.318 bln
9.4%
jan 1, 2012
28.905 bln
+1.93 bln
7.16%
jan 1, 2013
30.33 bln
+1.425 bln
4.93%
jan 1, 2014
32.006 bln
+1.677 bln
5.53%
jan 1, 2015
32.956 bln
+949.494 mln
2.97%
jan 1, 2016
32.962 bln
+6.184 mln
0.02%
Ranking of countries by current statistics by years


Comments: