29
/
en
AIzaSyAYiBZKx7MnpbEhh9jyipgxe19OcubqV5w
April 1, 2024
68900
Antigua and Barbuda
ATG
true
2
1
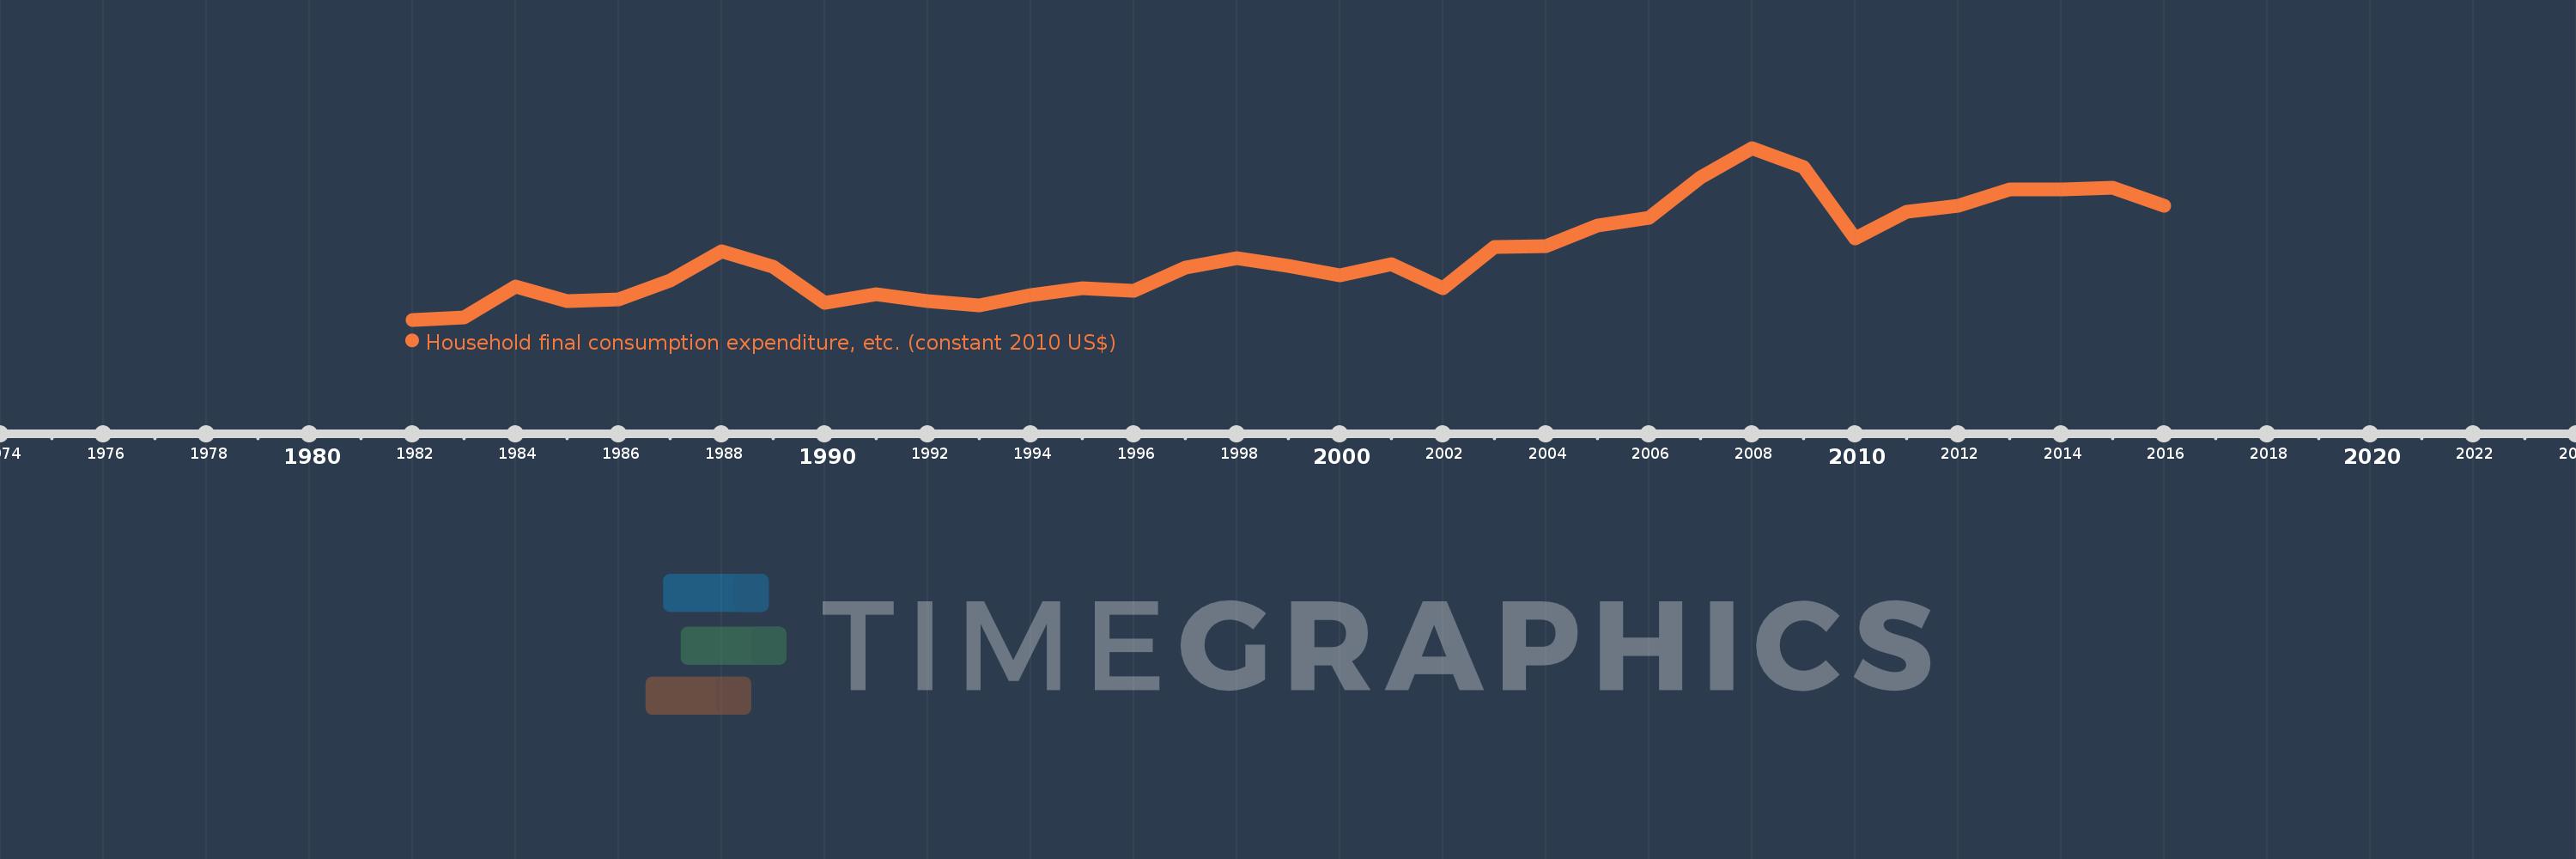
Household final consumption expenditure, etc. (constant 2010 US$)
2016,2015,2014,2013,2012,2011,2010,2009,2008,2007,2006,2005,2004,2003,2002,2001,2000,1999,1998,1997,1996,1995,1994,1993,1992,1991,1990,1989,1988,1987,1986,1985,1984,1983,1982
This statistics in other country:
AfghanistanAlbaniaAlgeriaAngolaAntigua and BarbudaArab WorldArgentinaArmeniaArubaAustraliaAustriaAzerbaijanBahamas, TheBahrainBangladeshBarbadosBelarusBelgiumBelizeBeninBermudaBhutanBoliviaBosnia and HerzegovinaBotswanaBrazilBrunei DarussalamBulgariaBurkina FasoBurundiCabo VerdeCambodiaCameroonCanadaCaribbean small statesCentral African RepublicCentral Europe and the BalticsChadChileChinaColombiaComorosCongo, Dem. Rep.Congo, Rep.Cote d'IvoireCroatiaCubaCyprusCzech RepublicDenmarkDominicaDominican RepublicEarly-demographic dividendEast Asia & PacificEast Asia & Pacific (excluding high income)East Asia & Pacific (IDA & IBRD countries)EcuadorEgypt, Arab Rep.El SalvadorEquatorial GuineaEritreaEstoniaEuro areaEurope & Central AsiaEurope & Central Asia (excluding high income)Europe & Central Asia (IDA & IBRD countries)European UnionFaroe IslandsFinlandFragile and conflict affected situationsFranceGabonGambia, TheGeorgiaGermanyGhanaGreeceGrenadaGuatemalaGuineaGuinea-BissauGuyanaHaitiHeavily indebted poor countries (HIPC)High incomeHondurasHong Kong SAR, ChinaHungaryIBRD onlyIcelandIDA & IBRD totalIDA blendIDA onlyIDA totalIndiaIndonesiaIran, Islamic Rep.IraqIrelandIsraelItalyJamaicaJapanJordanKazakhstanKenyaKorea, Rep.KosovoKuwaitKyrgyz RepublicLao PDRLate-demographic dividendLatin America & Caribbean Latin America & Caribbean (excluding high income)Latin America & the Caribbean (IDA & IBRD countries)LatviaLeast developed countries: UN classificationLebanonLiberiaLithuaniaLow & middle incomeLow incomeLower middle incomeLuxembourgMacao SAR, ChinaMacedonia, FYRMadagascarMalawiMalaysiaMaliMaltaMauritaniaMauritiusMexicoMiddle East & North AfricaMiddle East & North Africa (excluding high income)Middle East & North Africa (IDA & IBRD countries)Middle incomeMoldovaMongoliaMontenegroMoroccoMozambiqueNamibiaNepalNetherlandsNew ZealandNicaraguaNigerNigeriaNorth AmericaNorwayOECD membersOmanOther small statesPakistanPanamaParaguayPeruPhilippinesPolandPortugalPost-demographic dividendPre-demographic dividendPuerto RicoQatarRomaniaRussian FederationRwandaSaudi ArabiaSenegalSerbiaSeychellesSierra LeoneSingaporeSlovak RepublicSloveniaSmall statesSouth AfricaSouth AsiaSouth Asia (IDA & IBRD)South SudanSpainSri LankaSt. Kitts and NevisSt. LuciaSt. Vincent and the GrenadinesSub-Saharan Africa Sub-Saharan Africa (excluding high income)Sub-Saharan Africa (IDA & IBRD countries)SudanSurinameSwazilandSwedenSwitzerlandTajikistanTanzaniaThailandTimor-LesteTogoTongaTrinidad and TobagoTunisiaTurkeyTurkmenistanUgandaUkraineUnited Arab EmiratesUnited KingdomUnited StatesUpper middle incomeUruguayUzbekistanVanuatuVenezuela, RBVietnamWest Bank and GazaWorldYemen, Rep.ZambiaZimbabwe Timeline:
This timeline shows a graph from 1982 to 2016 of Antigua and Barbuda. No data until 1981. Number of actual observations by date: 35.
Source name:
World Development Indicators
Source organization:
World Bank national accounts data, and OECD National Accounts data files.
Categories, topics:
Economy & Growth
Last updated:
apr 23, 2017
Indicators value changes by year
Minimum:
311.108 mln
jan 1, 1982
Maximum:
1.027 bln
jan 1, 2008
At the date of observation
Value
Absolute change
Change from previous value
jan 1, 1982
311.108 mln
+311.108 mln
0.0%
jan 1, 1983
319.239 mln
+8.131 mln
2.61%
jan 1, 1984
450.948 mln
+131.709 mln
41.26%
jan 1, 1985
388.33 mln
-62.618 mln
-13.89%
jan 1, 1986
395.007 mln
+6.677 mln
1.72%
jan 1, 1987
473.808 mln
+78.801 mln
19.95%
jan 1, 1988
596.196 mln
+122.388 mln
25.83%
jan 1, 1989
531.892 mln
-64.304 mln
-10.79%
jan 1, 1990
383.329 mln
-148.563 mln
-27.93%
jan 1, 1991
417.102 mln
+33.773 mln
8.81%
jan 1, 1992
388.648 mln
-28.454 mln
-6.82%
jan 1, 1993
369.772 mln
-18.876 mln
-4.86%
jan 1, 1994
414.98 mln
+45.208 mln
12.23%
jan 1, 1995
443.549 mln
+28.569 mln
6.88%
jan 1, 1996
432.209 mln
-11.34 mln
-2.56%
jan 1, 1997
527.317 mln
+95.108 mln
22.01%
jan 1, 1998
567.12 mln
+39.803 mln
7.55%
jan 1, 1999
535.901 mln
-31.219 mln
-5.5%
jan 1, 2000
497.816 mln
-38.084 mln
-7.11%
jan 1, 2001
542.992 mln
+45.176 mln
9.07%
jan 1, 2002
441.412 mln
-101.58 mln
-18.71%
jan 1, 2003
613.46 mln
+172.048 mln
38.98%
jan 1, 2004
618.934 mln
+5.474 mln
0.89%
jan 1, 2005
704.47 mln
+85.535 mln
13.82%
jan 1, 2006
734.721 mln
+30.252 mln
4.29%
jan 1, 2007
905.001 mln
+170.28 mln
23.18%
jan 1, 2008
1.027 bln
+122.129 mln
13.49%
jan 1, 2009
947.329 mln
-79.801 mln
-7.77%
jan 1, 2010
650.586 mln
-296.743 mln
-31.32%
jan 1, 2011
762.479 mln
+111.894 mln
17.2%
jan 1, 2012
787.392 mln
+24.913 mln
3.27%
jan 1, 2013
852.722 mln
+65.329 mln
8.3%
jan 1, 2014
854.151 mln
+1.429 mln
0.17%
jan 1, 2015
861.788 mln
+7.637 mln
0.89%
jan 1, 2016
785.391 mln
-76.397 mln
-8.86%
Ranking of countries by current statistics by years


Comments: